 SEPS
Society for Evolutionary Parasite Systematics
SEPSM. R. Dwyer
Research and technical report. No validated end-to-end identification performance claimed.
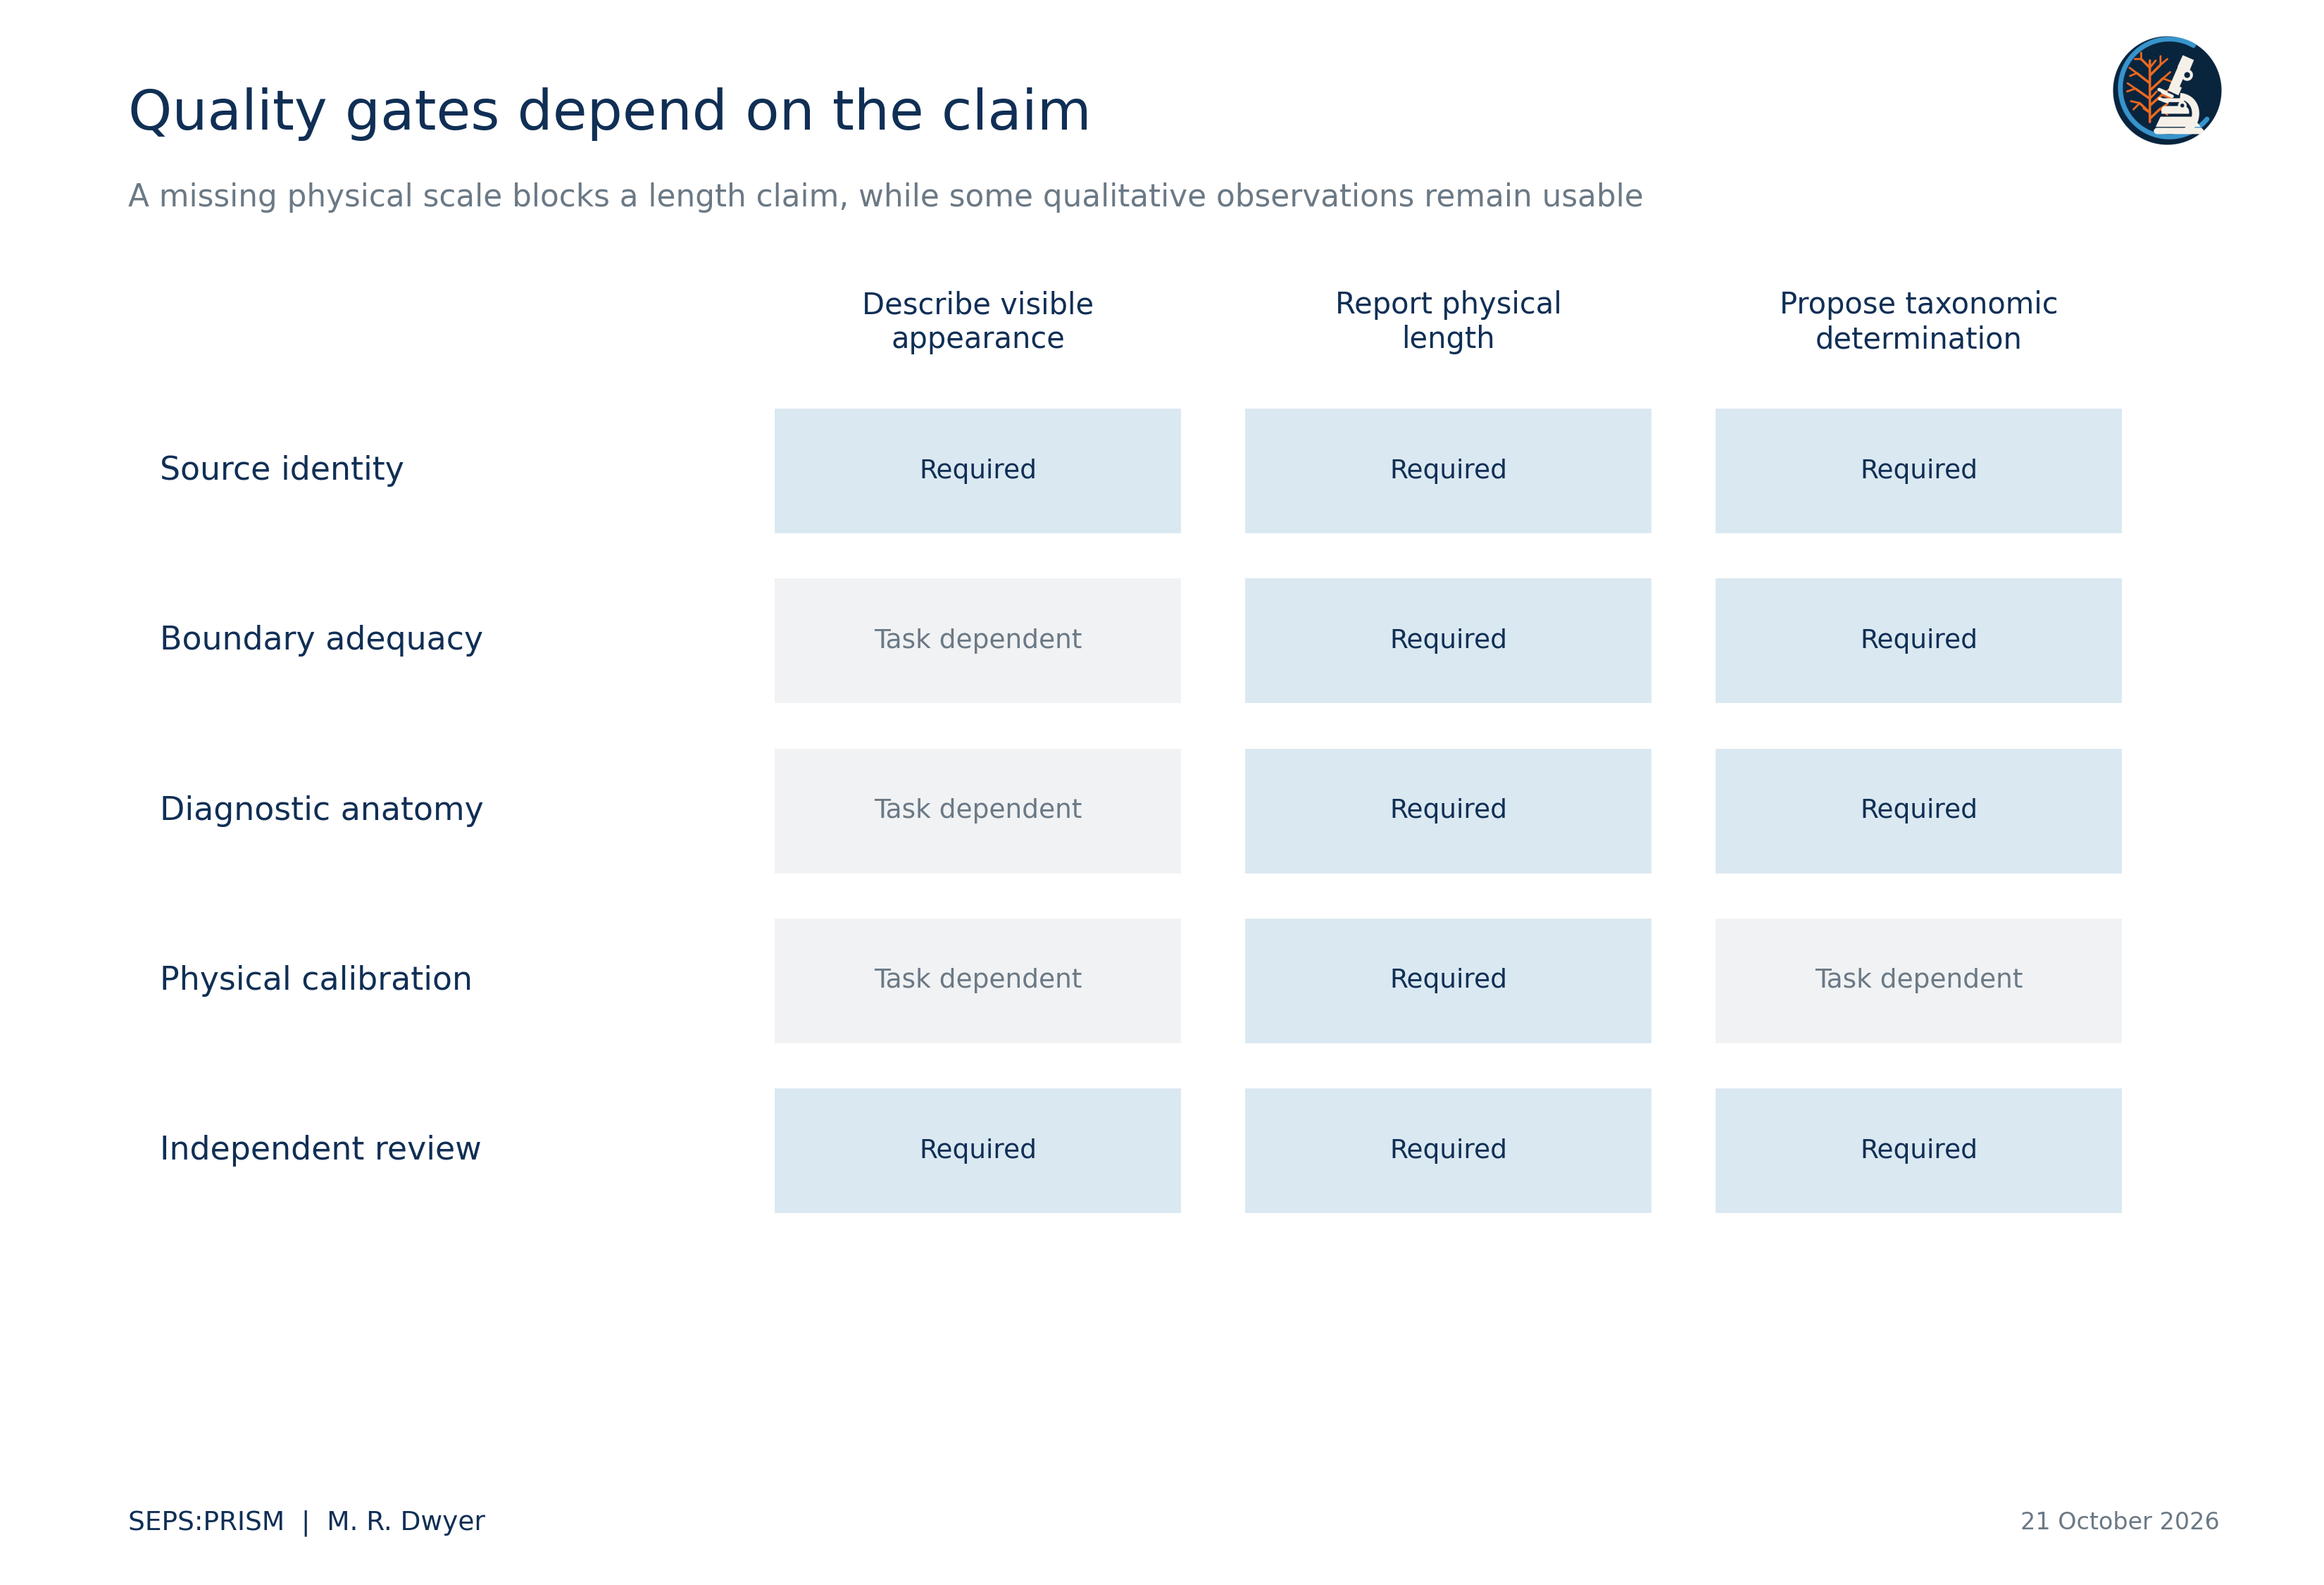
We specify a reproducible route from specimen images to defensible morphological claims. SEPS:PRISM separates acquisition, boundary review, diagnostic measurement, candidate comparison and expert interpretation. We define the mathematical quantities that support conventional measurements, polygon descriptors, elliptic Fourier analysis and landmark shape analysis, then connect each quantity to calibration, tracing and sampling assumptions. The accompanying empirical analyses use recovered host counts, two photographed nematode profiles and published pentastome landmarks. They demonstrate specific computations rather than validated automated identification. We treat image readability, measurement accuracy and taxonomic adequacy as separate outcomes. This distinction allows useful observations to survive incomplete records while preventing a polished derivative from supplying evidence that the specimen never provided.
SEPS investigates parasite diversity, diagnostic morphology and host associations. We use software to preserve and compare specimen evidence, not to replace a taxonomic argument. A useful output explains which structure we observed, how we measured it, which comparative material we consulted and what remains unresolved. We retain this chain for an early student observation and for a specialist determination alike. A reader should understand the observation before encountering the machinery that processed it.
We follow the SEPS:PRISM methodology reference, version 1.2, dated 18 October 2026 (Dwyer, 2026a). FieldView or direct laboratory import captures originals and context. TEGUMENT prepares source-linked crops and reviewed specimen boundaries. HookFuse quantifies diagnostic structures when the task supports them. A candidate-comparison stage runs only a supported task model. FUZZARIA preserves evidence-quality assessments, contradictions and reporting limits. Expert review confirms, corrects or leaves the conclusion unresolved. PARAPLEX uses the reviewed specimen and examination records for downstream ecological analysis. SEPS Lens names a proposed interface rather than an additional analytical phase.
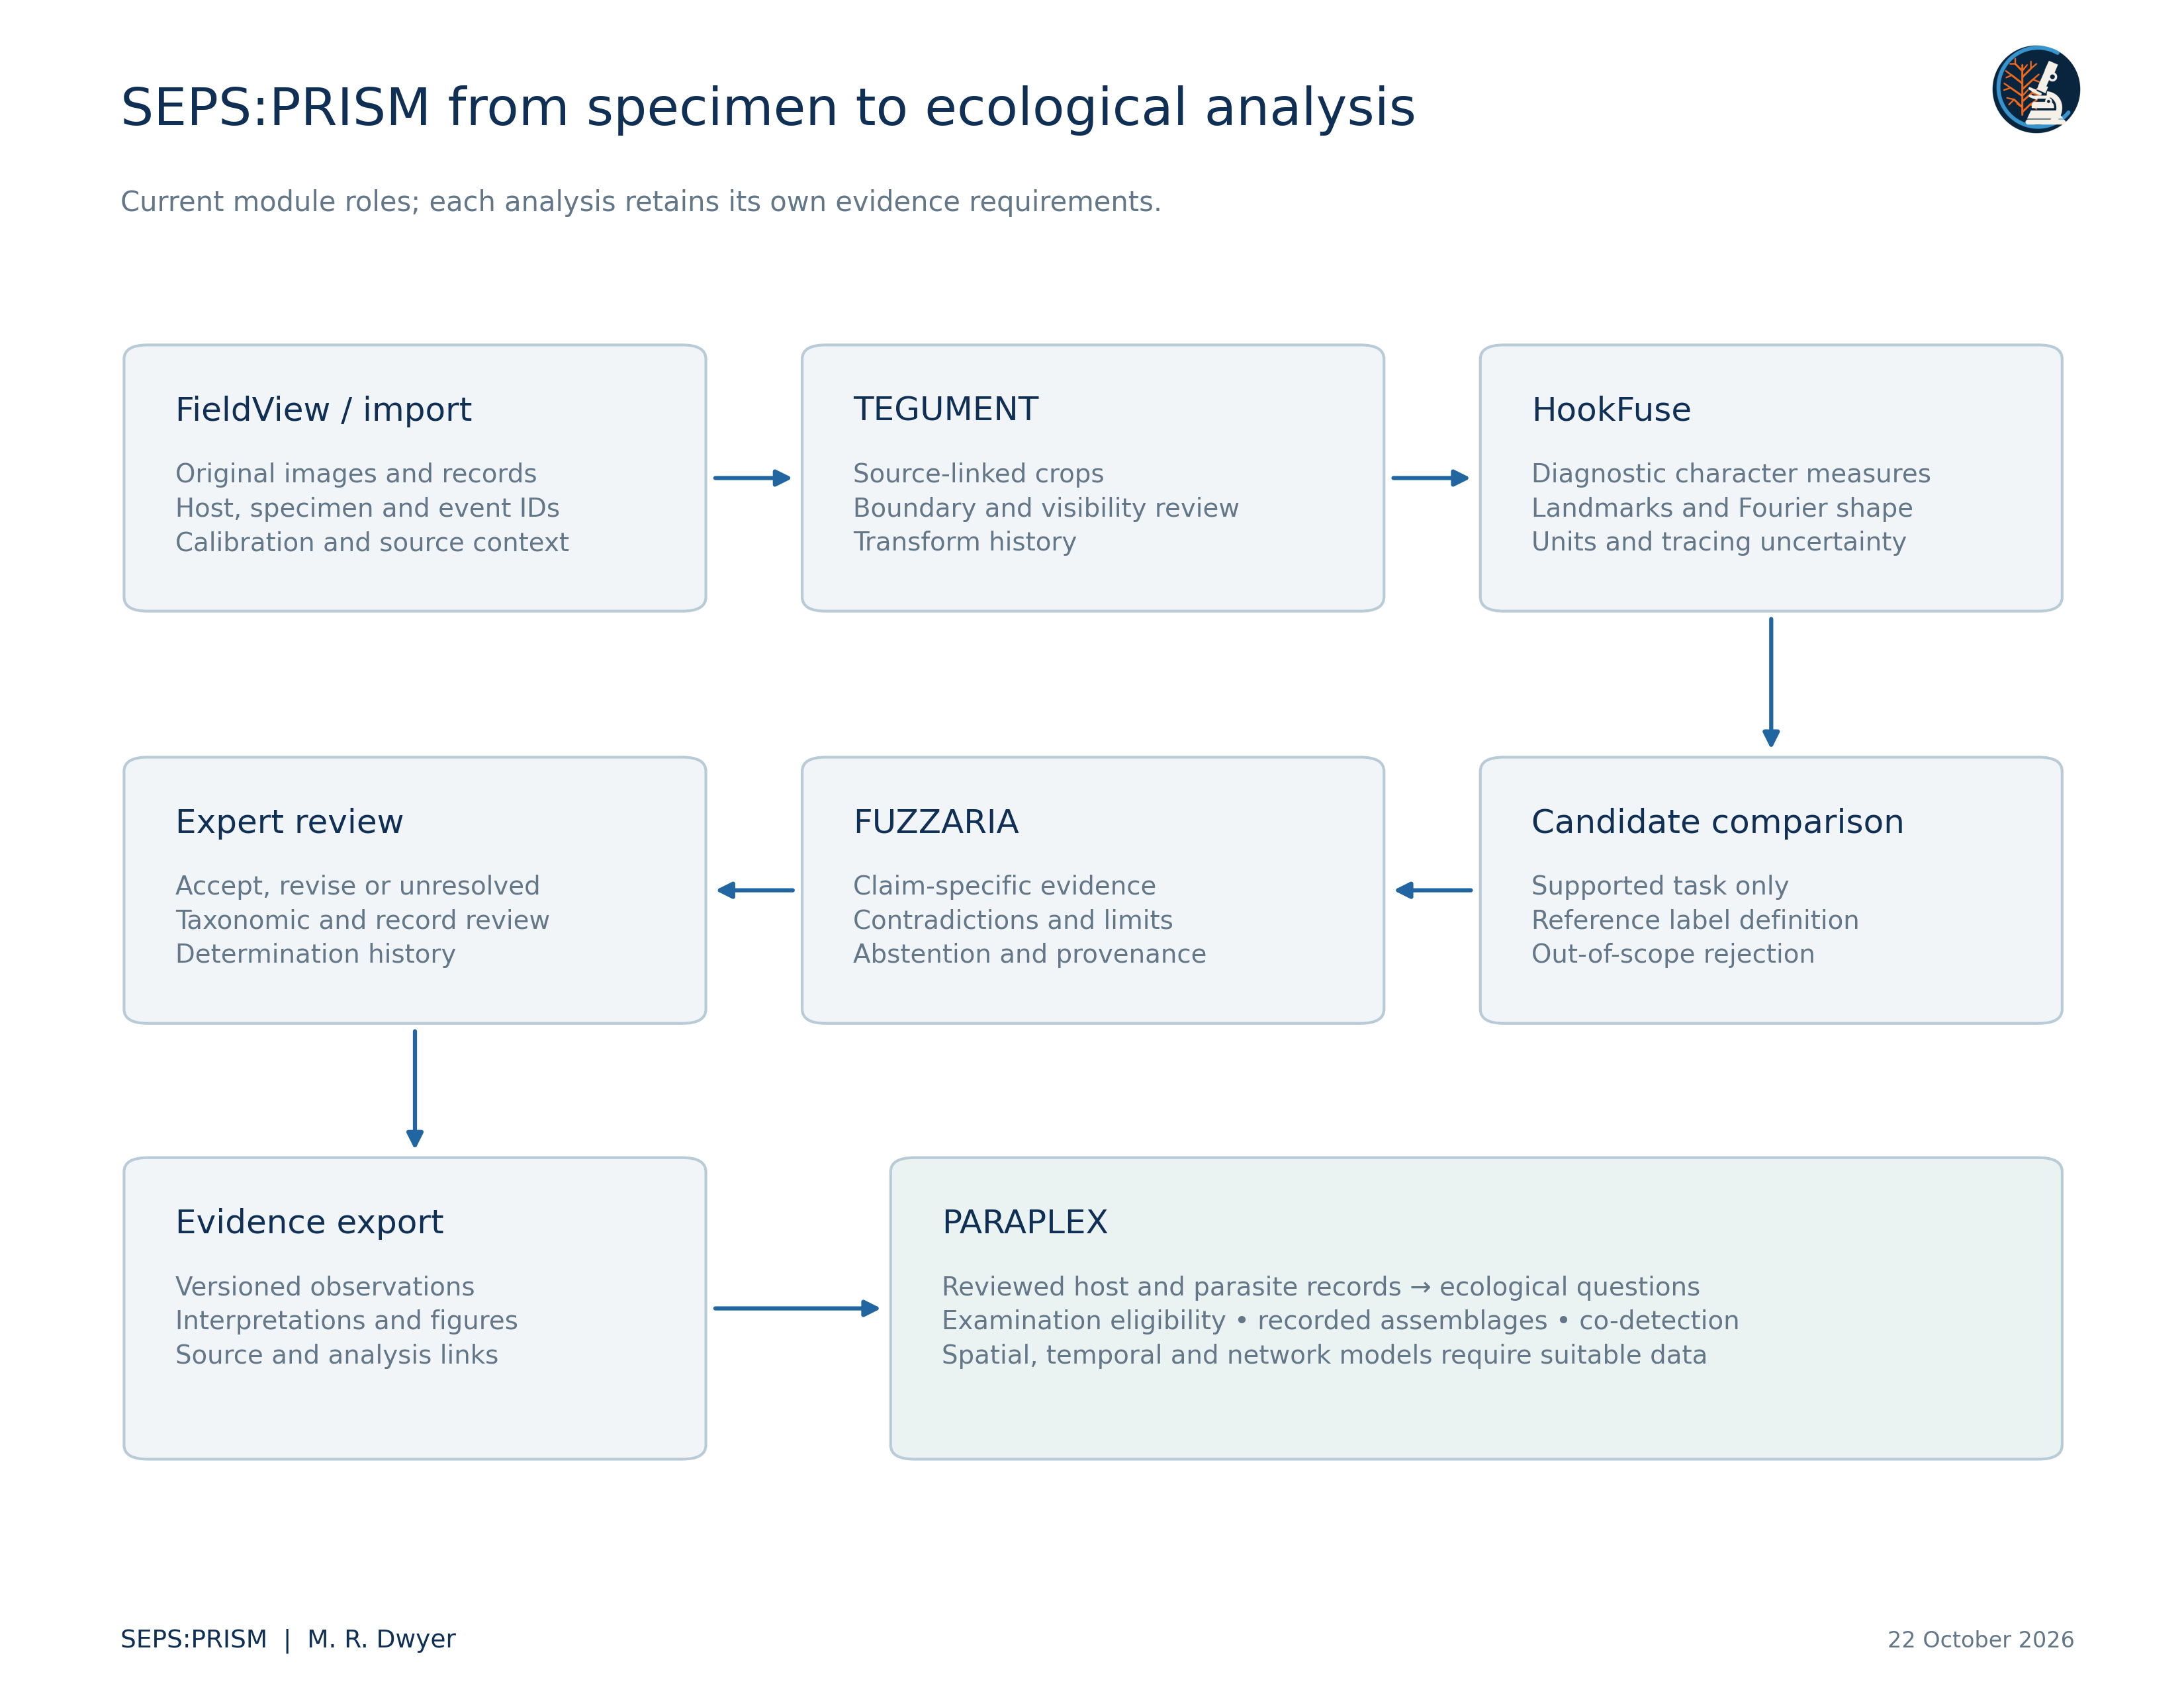
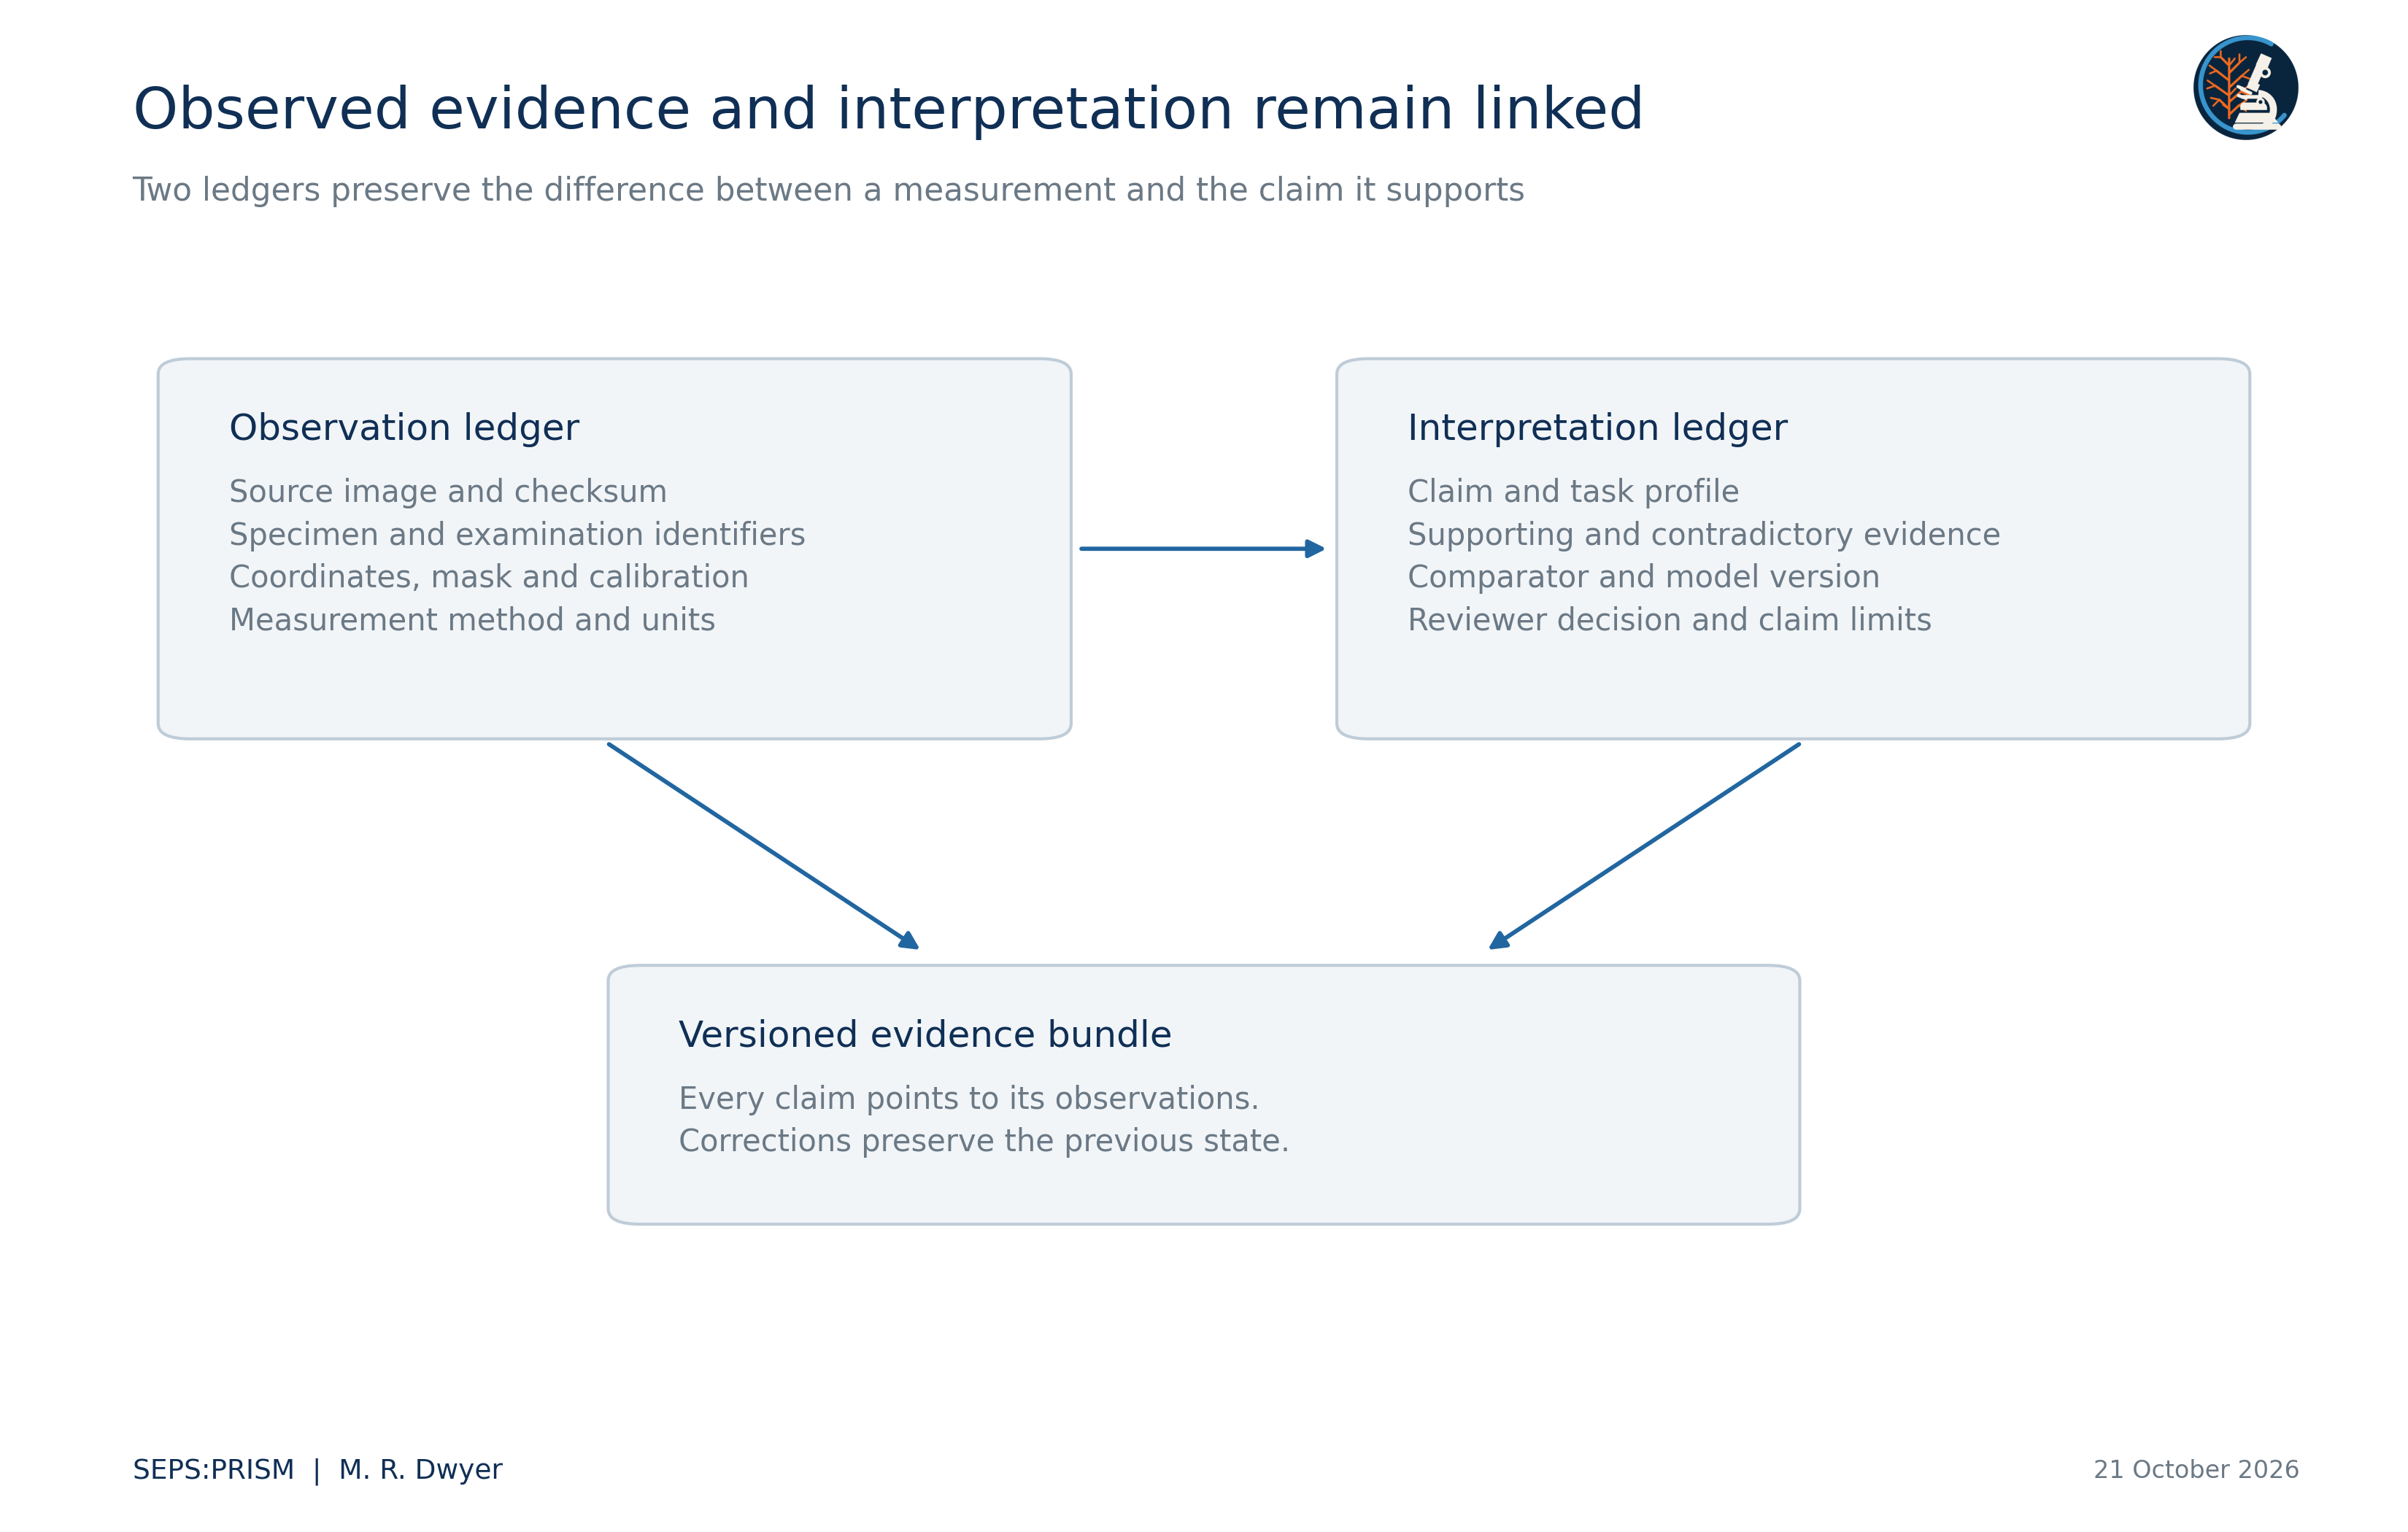
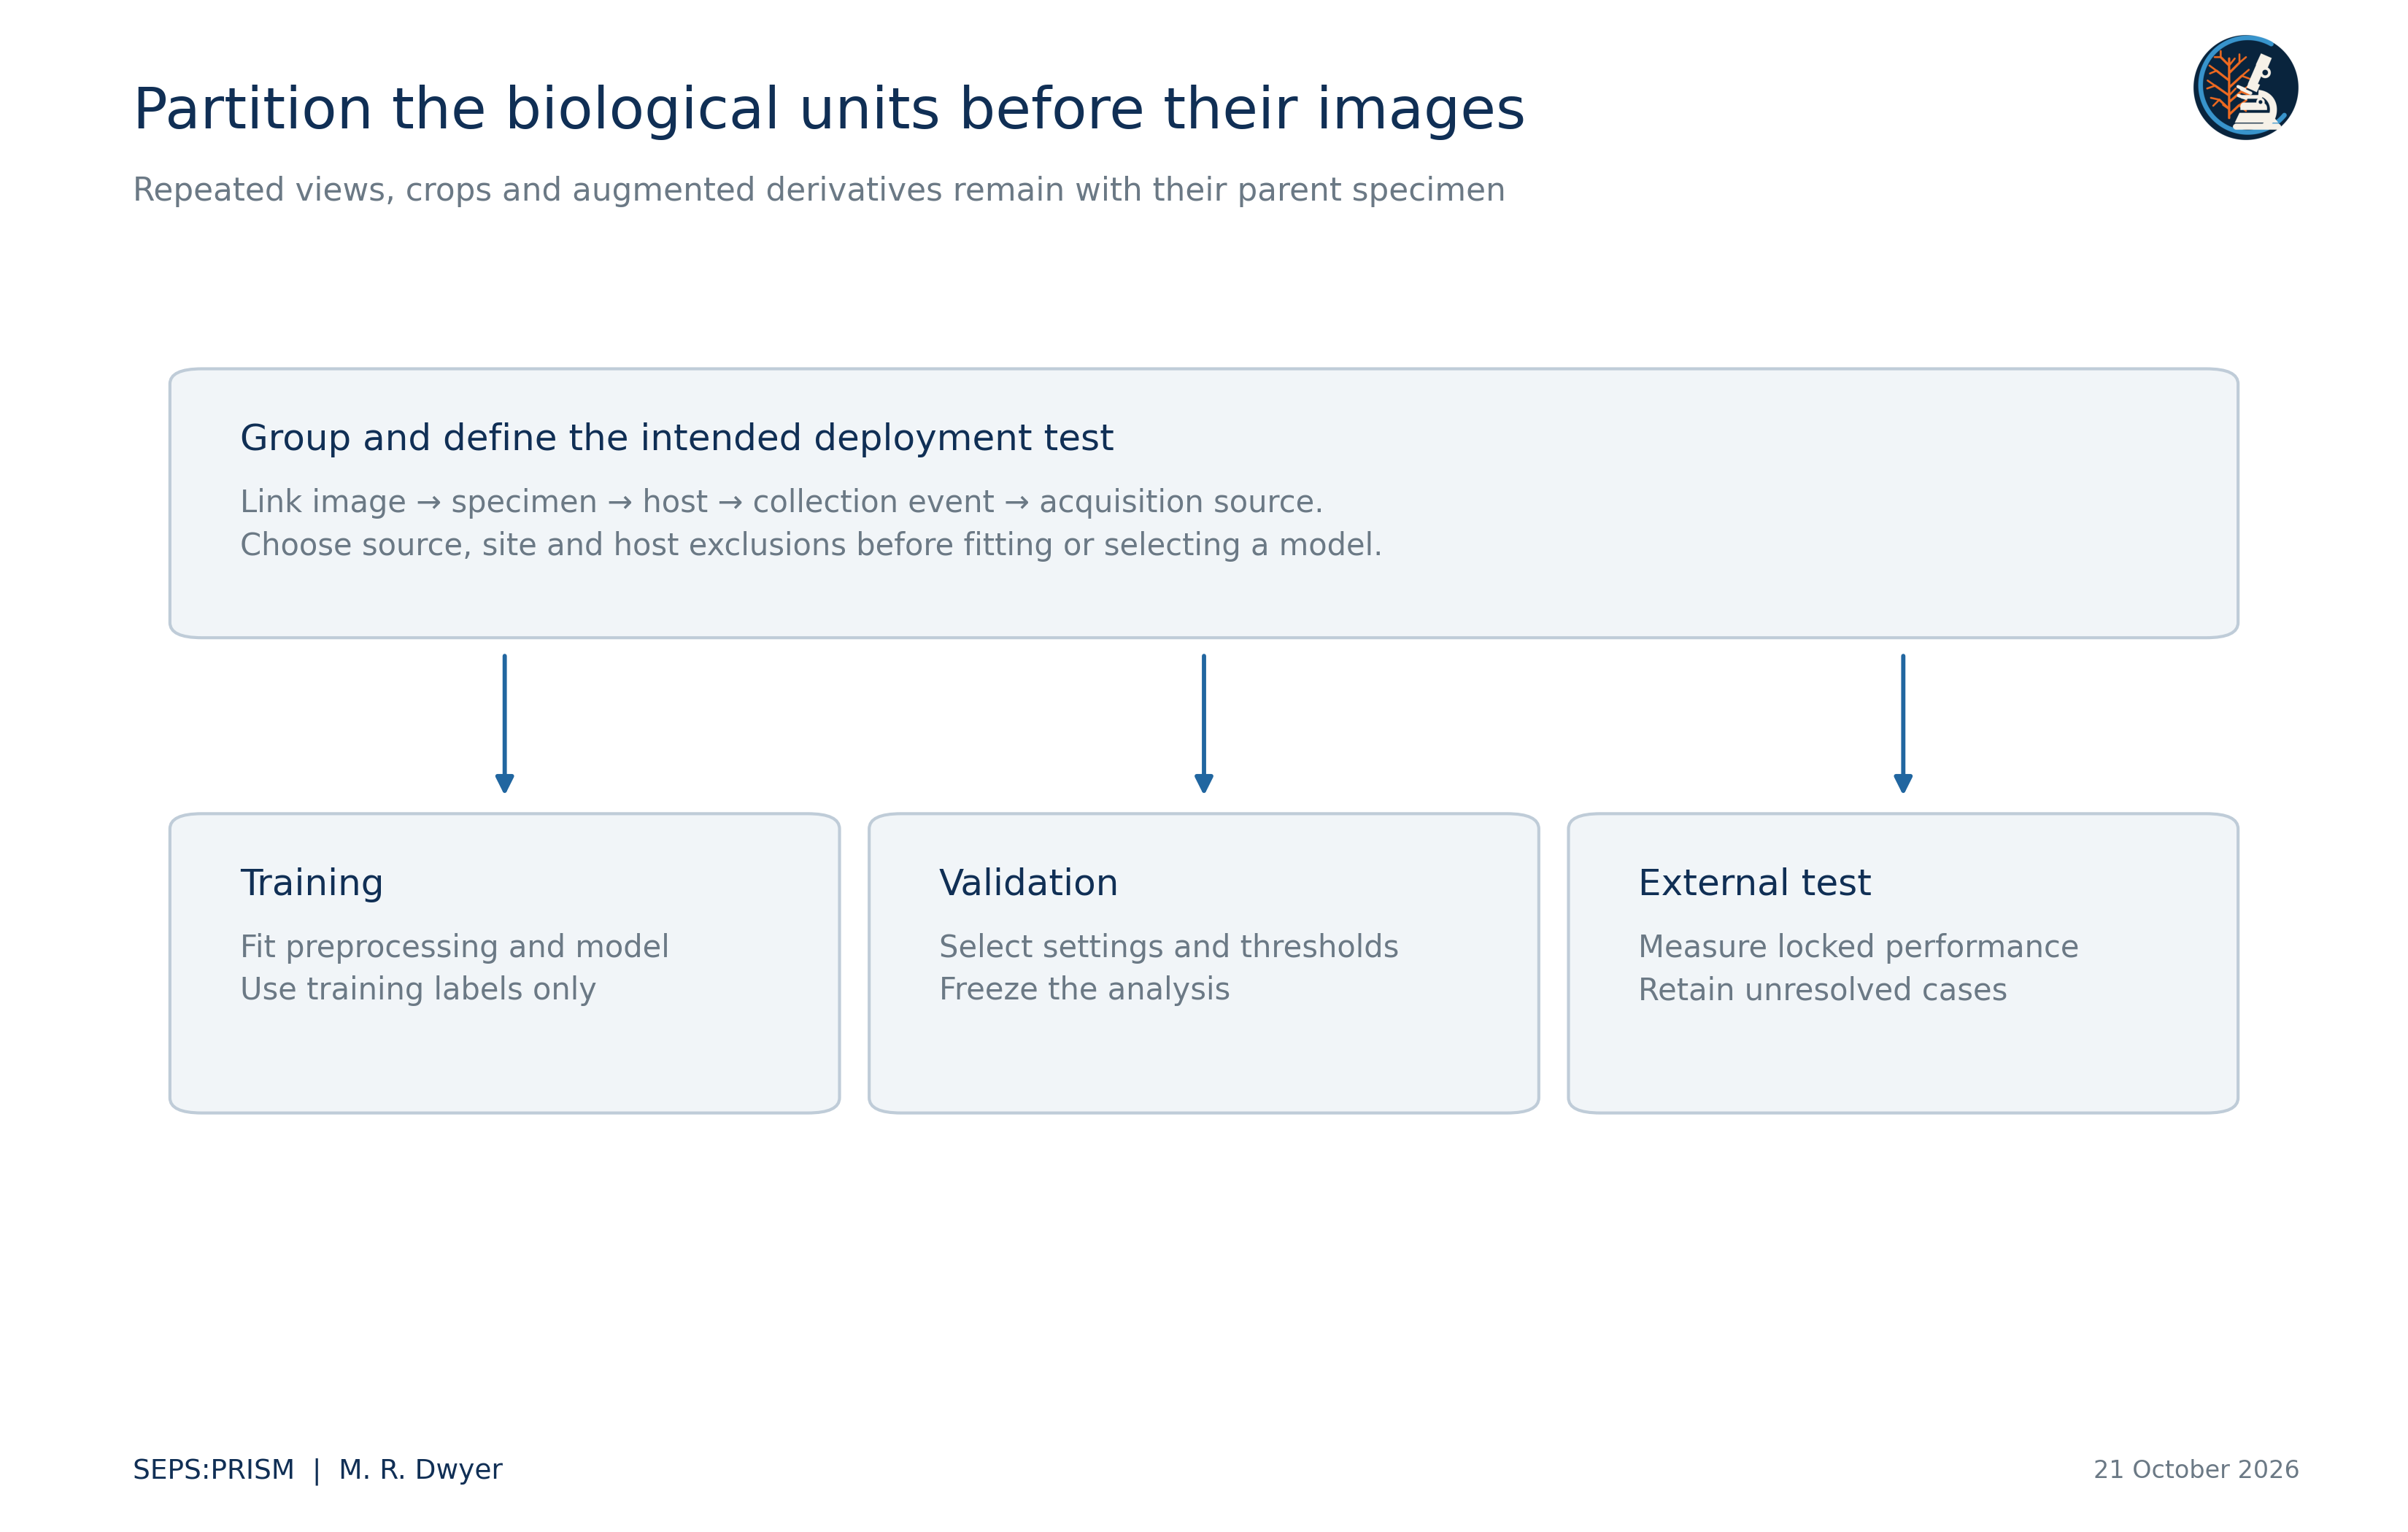
We distinguish a biological individual from a container, image, crop, image region and analytical row. One host may contribute several examinations; one examination may yield several recovery lots; one lot may contain several parasites; one parasite may generate many images. We retain these relationships explicitly. A photograph without a specimen link remains a documented image, but it cannot silently become an independent specimen in a training set or a new host record.
We record the acquisition image I, source-coordinate region R, task T, calibration K, transformation history H and reviewer decision V. A derived quantity y = f(I,R,T,K,H) remains conditional on those inputs. We retain the original image and the parameters of f so that another analyst can reproduce the value. We distinguish an observed character state from a classifier suggestion and from the final determination. Multiple models that read the same crop share its optical and anatomical limitations.
 (1)
Here L_b denotes the physical length printed on a verified source scale bar, b denotes its length in source pixels, and s converts source pixels to physical units. We measure endpoints and scale in the same unresampled coordinate system. A magnification label alone does not supply s after unknown cropping, resampling or screen photography.
 (2)
This first-order expression makes the calibration contribution explicit. We use the covariance term when scale and endpoint estimates share a source of error. We do not report a statistical confidence interval when we have only a chosen endpoint-displacement scenario. A two-dimensional distance also remains a projected distance when the structure extends out of the image plane.
For isotropic resampling by a known factor r, we transform coordinates by x′ = rx and physical scale by s′ = s/r. Anisotropic resampling changes shape and requires an explicit inverse transform before geometric comparison. We keep the image-axis convention in every coordinate table. Missing calibration prevents physical length and area claims but does not automatically prevent a visible-character description or a dimensionless shape computation.
 (3)
We close the polygon by setting p_(m+1) = p_1. Area A uses squared image units and perimeter P uses image units. We inspect the trace for self-intersections, clipped boundaries and bridges across overlapping organisms before interpreting either quantity.
 (4)
Circularity C, area-equivalent diameter D_A and Feret ratio F describe different properties. We obtain maximum Feret diameter from the convex-hull point distances and minimum Feret diameter from the smallest hull support width. We do not rename Feret ratio eccentricity. A thin omitted structure may change a diagnostically important dimension while barely changing overlap area.
The current nematode experiment uses assistant-initialized polygon vertices and therefore requires independent boundary review. We retain those coordinates instead of reporting an untraceable vector outline. Repeated annotation by several reviewers would allow us to partition specimen, reviewer and residual variance. A hand-chosen ±2-pixel displacement supplies a sensitivity experiment only; it does not estimate the distribution of actual tracing error.
 (5)
We use an analogous expansion for y(t), with coefficients c_n and d_n. The closed polygon traverses each segment at constant speed, so segment duration Δt_i equals its Euclidean length and total duration T equals perimeter. Kuhl and Giardina (1982) provide the elliptic Fourier framework.
 (6)
 (7)
We replace Δx_i by Δy_i to obtain c_n and d_n. We compute the constant term as the perimeter-weighted average of segment midpoints. We preserve the phase convention and traversal direction because changing either changes the coefficient vector.
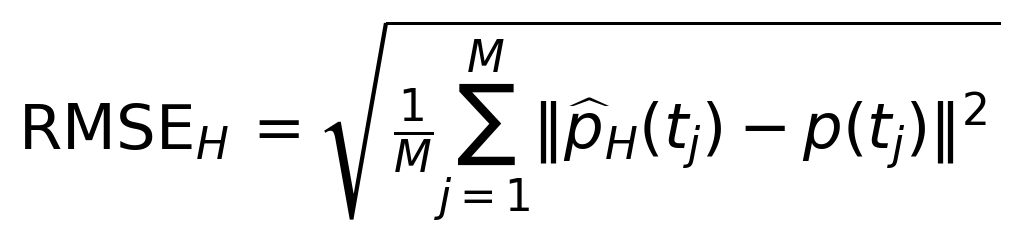 (8)
We compare reconstructed and polygon positions at M = 512 equally spaced perimeter positions. This error tests numerical reconstruction of the selected trace. It cannot validate that the trace follows the correct anatomical structure. We retain harmonic count and normalization as part of the analysis definition rather than optimizing them on a final test set.
 (9)
 (10)
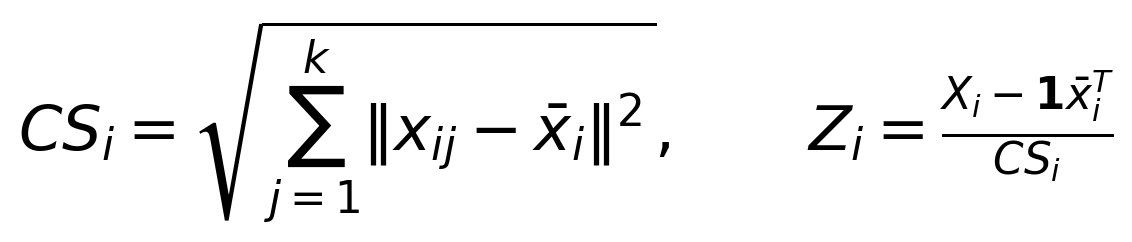
We center each k-landmark configuration, divide by centroid size CS_i and align it by rotation without reflection. Generalized Procrustes analysis supplies a shared shape coordinate system (Gower, 1975). We retain centroid size separately and do not interpret source-coordinate pixels as physical dimensions without verified calibration.
Anatomical correspondence must precede this alignment. Arbitrary contour vertices do not become homologous landmarks because an algorithm can align them. We preserve host grouping when several parasite configurations come from one host. The reference analysis based on Westfall et al. (2019) therefore shows both individual configurations and host means, and it evaluates repeated-identifier alternatives explicitly.
 (11)
These overlap measures compare a proposed mask M with a reviewed reference G. Neither metric determines whether the mask retains a small polar plug, hook tip or other diagnostic structure. We pair overlap with structure-specific visibility, endpoint error and topology checks selected before evaluation.
 (12)
For a score threshold τ, coverage records the fraction of evaluated cases that the system accepts. Conditional error among accepted cases requires a separate calculation using expert reference labels. We report both quantities with the unit of independence and acquisition domain. An image-readiness score does not become a calibrated probability of correct species identification.
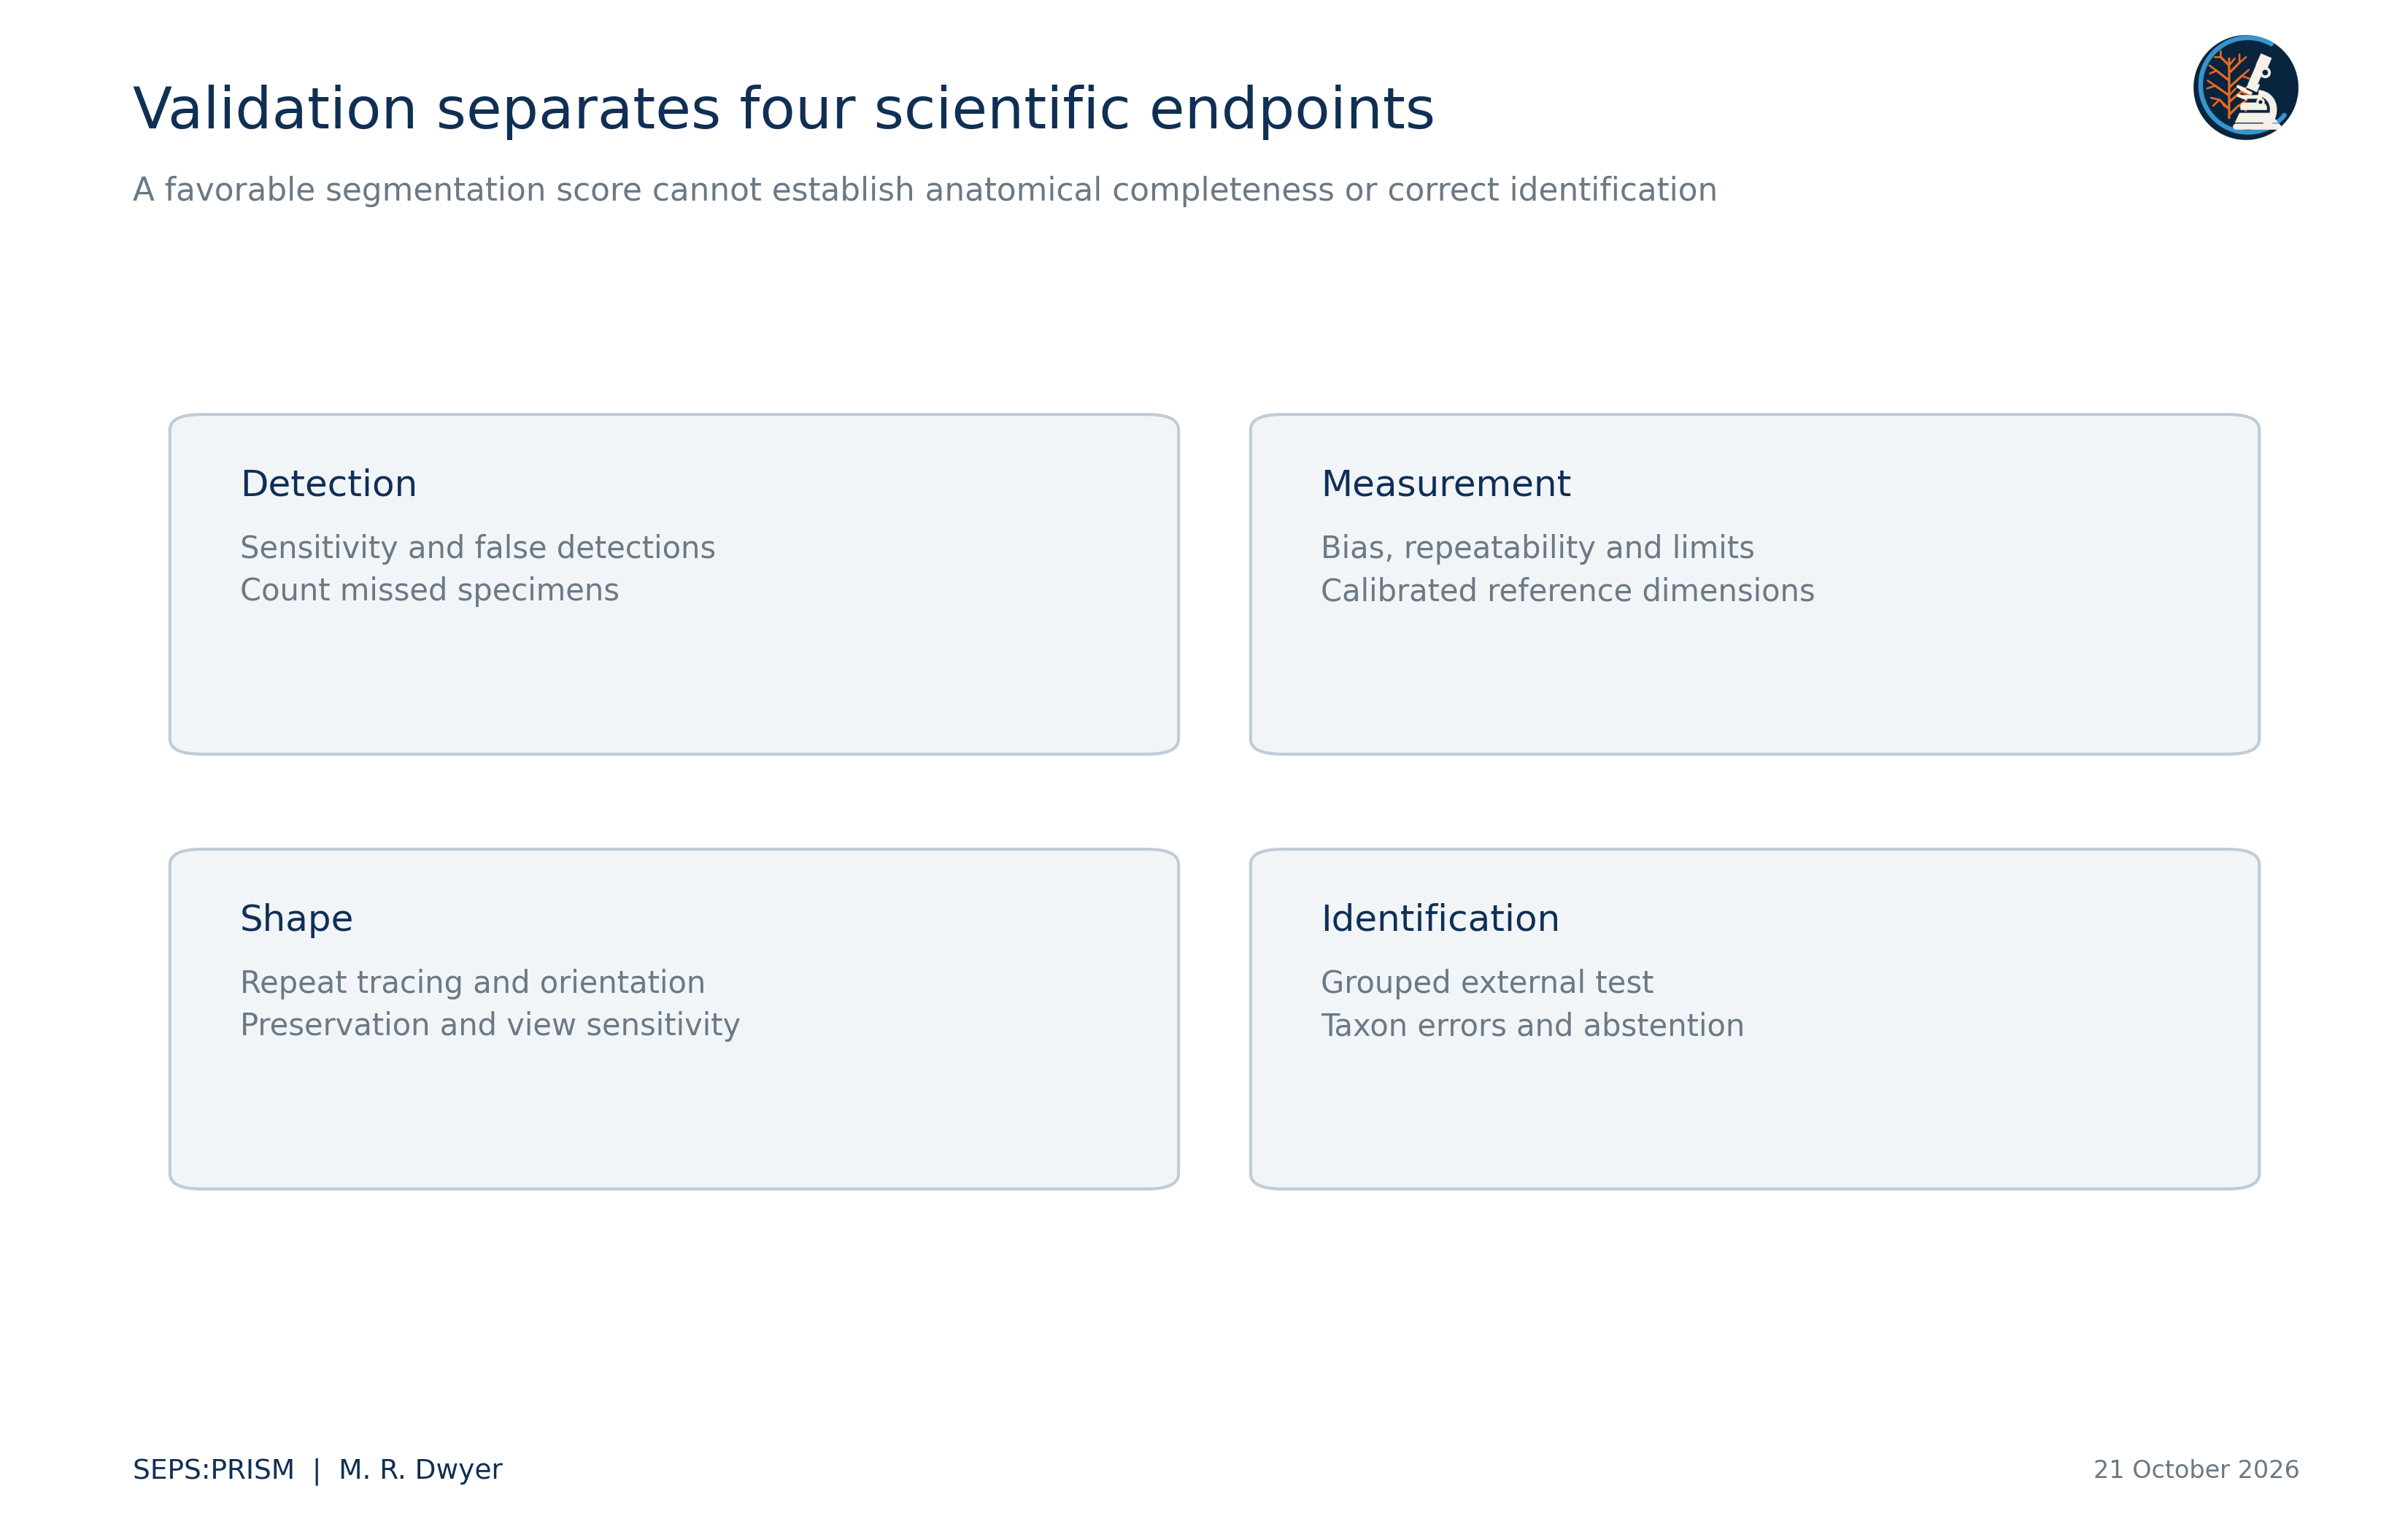
We evaluate image detection, measurement error, shape repeatability and taxonomic classification separately. Adult and egg tasks retain separate class definitions. The adult comparison target in the current specification includes Raillietiella orientalis and the genus-level groups Armillifer and Porocephalus; these mixed taxonomic ranks require explicit task labels. A model that recognizes one profile cannot establish comprehensive pentastome identification.
PARAPLEX expands Parasite Assemblage and Relationship Analysis across Populations, Landscapes, and Ecological eXchange. It adds an ecological inference layer downstream of reviewed SEPS:PRISM records and preserves the roles of FieldView, TEGUMENT, HookFuse and FUZZARIA (Dwyer, 2026e). Its inputs distinguish the host from the recovery lot and the examination event. It retains anatomical identification limits and records whether each target group received an adequate examination. A high image-quality score cannot establish that an unrecorded taxon was absent.
The implementation in this collection executes deterministic ingestion, source-label mapping, host-level documentary summaries and co-detection counts. It also reconciles follow-up identification rows and exports every derived table. These executed functions do not establish that occupancy models, transmission networks or causal community models have undergone validation. We reserve those analyses for data that meet their own sampling and observation requirements.
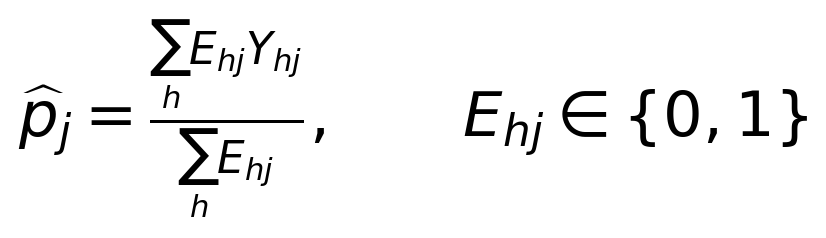 (13)
Here E_hj denotes documented eligibility and examination completeness for host h and target j. Y_hj denotes a defined detection result in the eligible set. We report the fraction only when the denominator is positive and its inclusion rule supports the stated estimand. The recovered workbook does not supply that completeness matrix, so the current PARAPLEX report describes positive records and unknown cells without estimating population prevalence. This distinction follows the denominator discipline of Bush et al. (1997).
We independently checked 66 numerical results across polygon geometry, Fourier reconstruction, Procrustes alignment, host-label permutations, archival count summaries and SEM distance sensitivity. All checks met their stated numerical tolerances. Independent implementations used perimeter quadrature for Fourier coefficients and analytic planar rotations for alignment. Numerical agreement verifies the stated calculations; it does not adjudicate anatomy or convert archival labels into new taxonomic determinations.
A reproducible image discrepancy can motivate a taxonomic investigation, but it does not constitute a new species description. We first test whether orientation, sex, development, preservation or tracing explains the difference. We then compare diagnostic characters across relevant descriptions, types or authenticated comparative material. Morphological revisions such as the Physaloptera studies illustrate the value of detailed structures and specimen context (Gorgani et al., 2013; Macedo et al., 2023). We retain specimen-level evidence for differential diagnosis and document molecular corroboration when it addresses the taxonomic question.
For education, we pair each measured character with its source image and a readable definition. For research, we supply coordinates, calculations and explicit sampling units. For clinical comparison, we identify the organism, preparation and endpoint of every external reference image. We do not convert a research prototype or an educational plate into a clinical diagnostic claim. The collection demonstrates manually reviewed and deterministic computations; it does not report a validated end-to-end SEPS classifier.
Bush, A. O., Lafferty, K. D., Lotz, J. M., & Shostak, A. W. (1997). Parasitology meets ecology on its own terms: Margolis et al. revisited. Journal of Parasitology, 83(4), 575–583. https://doi.org/10.2307/3284227
Dwyer, M. R. (2026a). SEPS:PRISM methodology reference (Version 1.2, 18 October 2026) [Methodology specification]. Society for Evolutionary Parasite Systematics.
Dwyer, M. R. (2026e). PARAPLEX ecological inference layer for SEPS:PRISM [Working module specification, 22 October 2026]. Society for Evolutionary Parasite Systematics.
Gorgani, T., Naem, S., Farshid, A. A., & Otranto, D. (2013). Scanning electron microscopy observations of the hedgehog stomach worm, Physaloptera clausa (Spirurida: Physalopteridae). Parasites & Vectors, 6, 87. https://doi.org/10.1186/1756-3305-6-87
Gower, J. C. (1975). Generalized Procrustes analysis. Psychometrika, 40(1), 33–51. https://doi.org/10.1007/BF02291478
Kuhl, F. P., & Giardina, C. R. (1982). Elliptic Fourier features of a closed contour. Computer Graphics and Image Processing, 18(3), 236–258. https://doi.org/10.1016/0146-664X(82)90034-X
Macedo, L. C., Willkens, Y., Silva, L. M. O., Gardner, S. L., Melo, F. T. V., & Santos, J. N. (2023). “Revisiting the past”: A redescription of Physaloptera retusa (Nemata, Physalopteridae) from material deposited in museums and new material from Amazon lizards. Revista Brasileira de Parasitologia Veterinária, 32(2), e017422. https://doi.org/10.1590/S1984-29612023016
Westfall, A. K., Miller, M. A., Murray, C. M., Falk, B. G., Guyer, C., & Romagosa, C. M. (2019). Host-specific phenotypic variation of a parasite co-introduced with invasive Burmese pythons. PLOS ONE, 14(1), e0209252. https://doi.org/10.1371/journal.pone.0209252
Wilson, E. B. (1927). Probable inference, the law of succession, and statistical inference. Journal of the American Statistical Association, 22(158), 209–212. https://doi.org/10.1080/01621459.1927.10502953