 SEPS
Society for Evolutionary Parasite Systematics
SEPSM. R. Dwyer
Research and technical report. No validated end-to-end identification performance claimed.
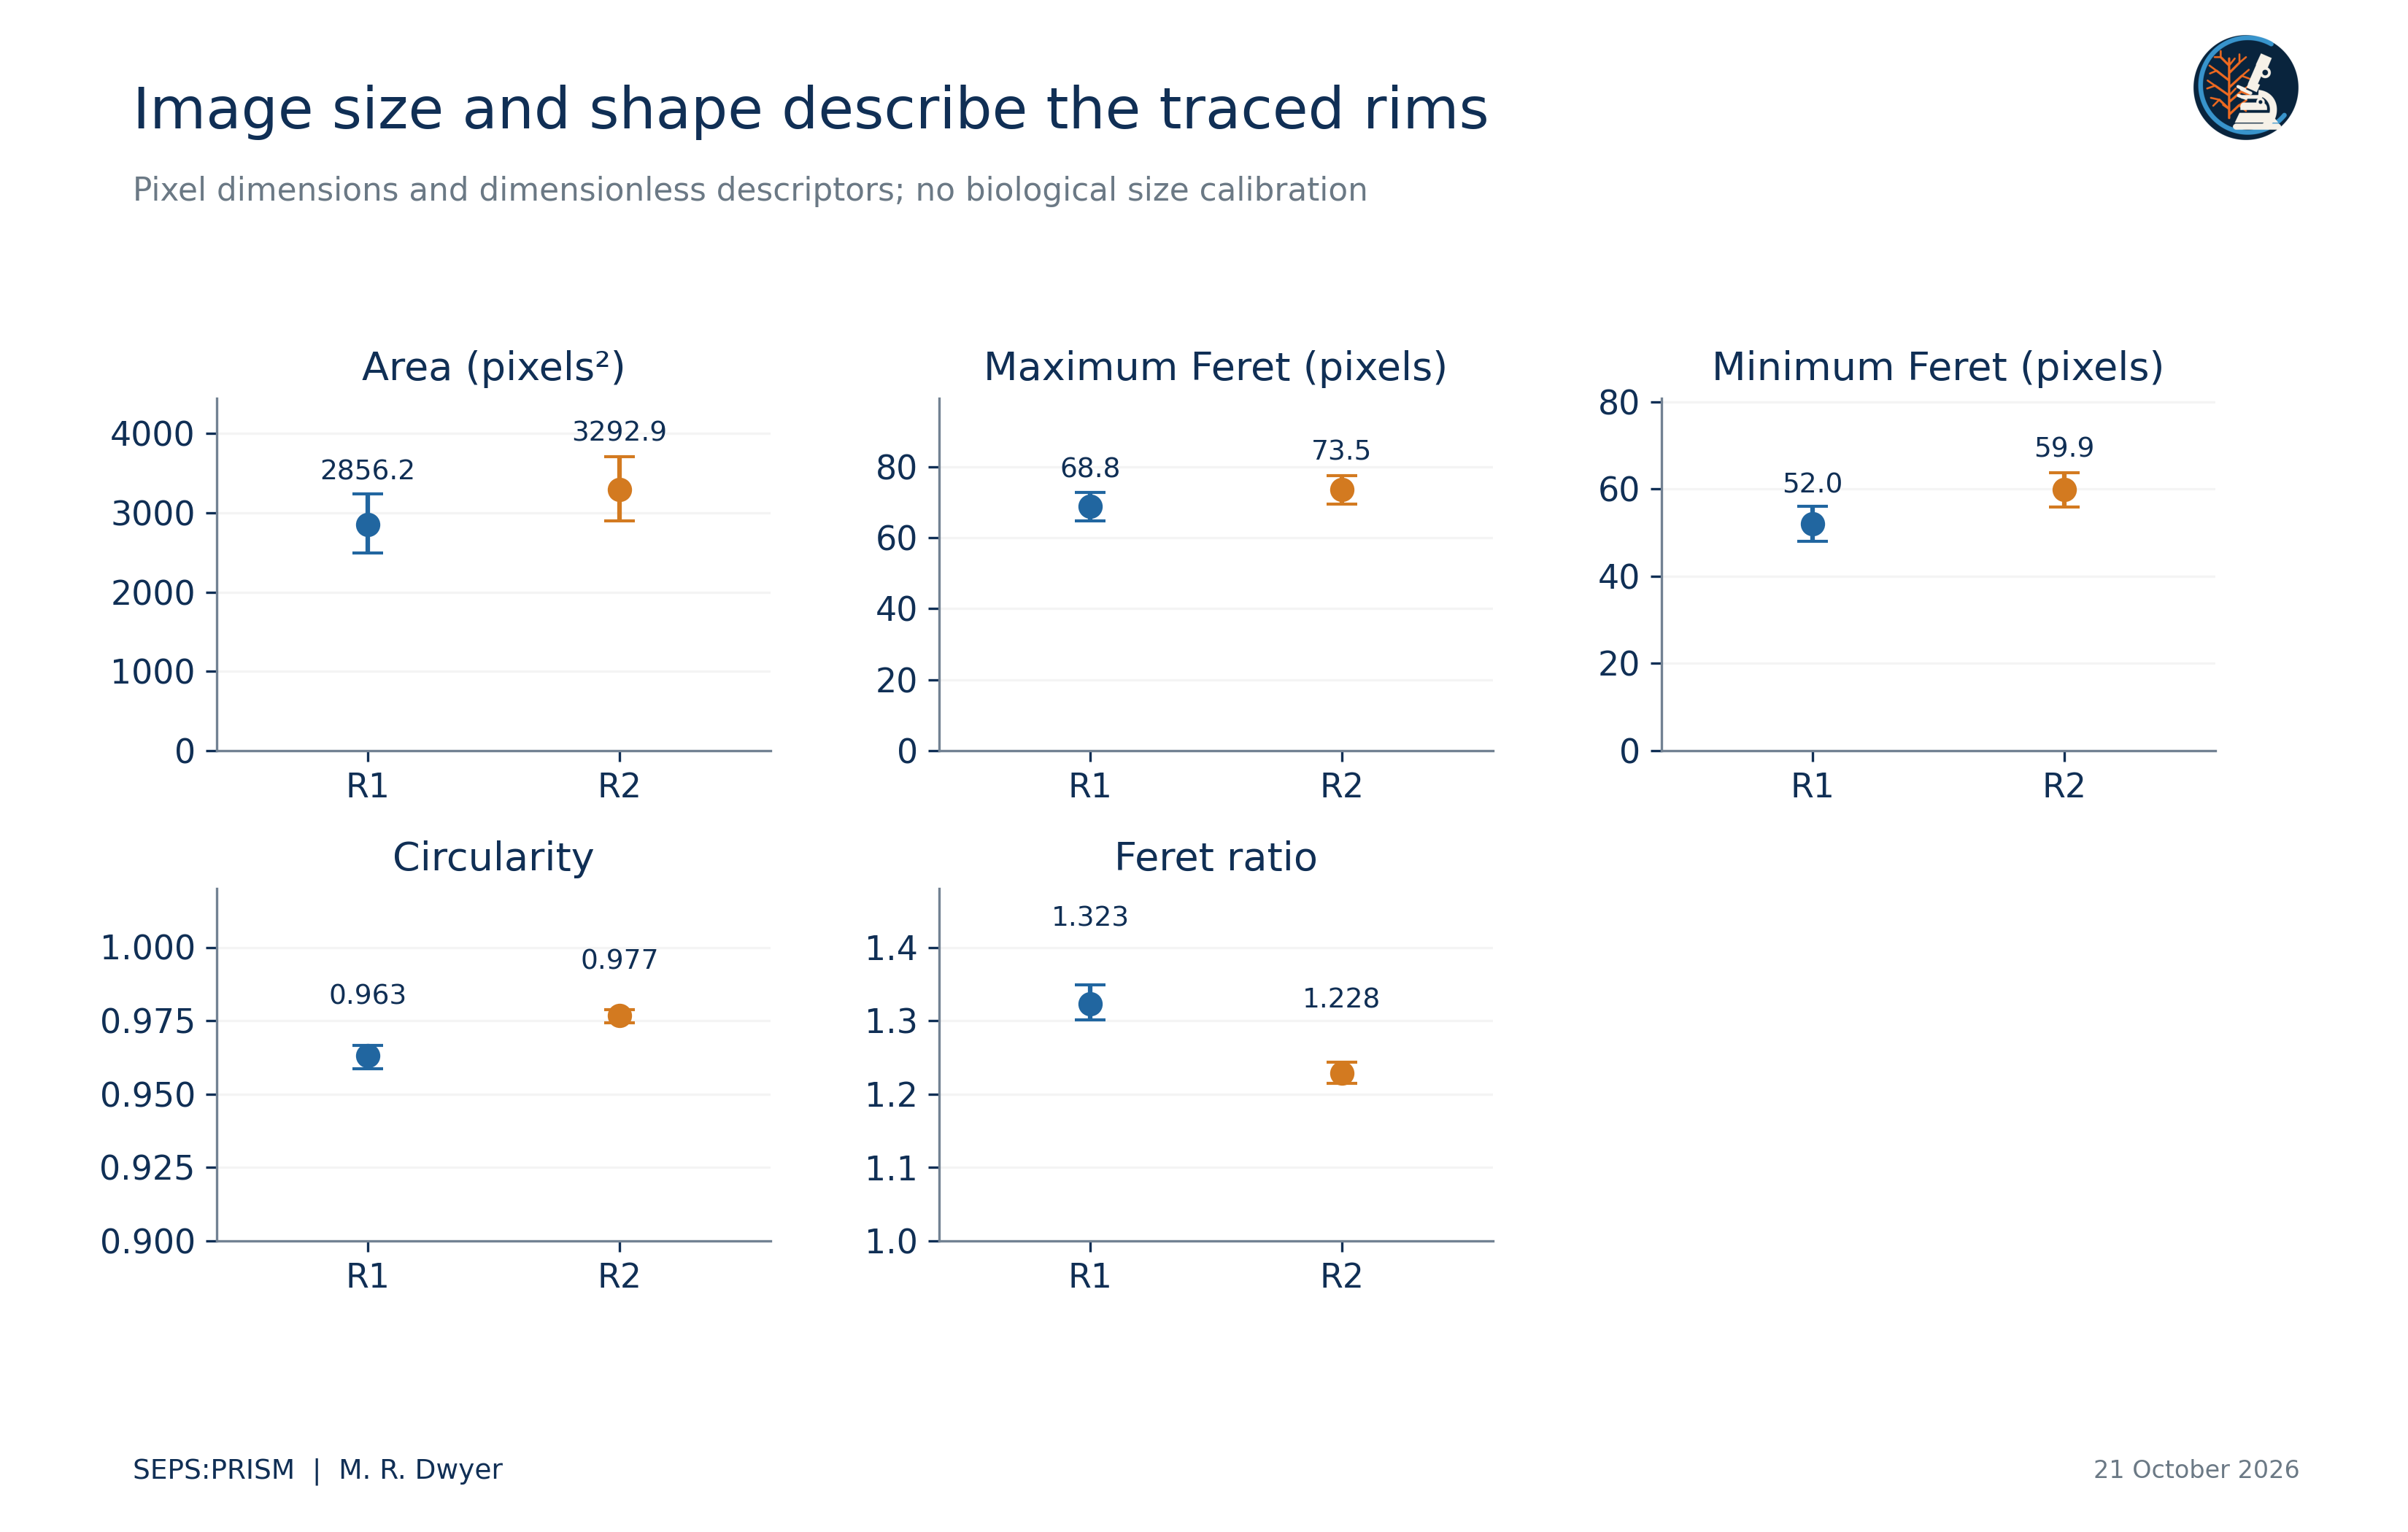
We recover two visible rim profiles from one brightfield nematode photograph and compute measurements from saved source-coordinate polygons. The profiles have areas of 2856.2 and 3292.88 squared source pixels, maximum Feret diameters of 68.84 and 73.54 pixels, and circularities of 0.9631 and 0.9766. We then calculate elliptic Fourier coefficients directly from the actual traces and quantify reconstruction error over 512 perimeter positions. At eight harmonics, root mean squared reconstruction error reaches approximately 0.097 and 0.116 source pixels. These small errors describe the selected polygons rather than anatomical accuracy. We retain neutral region labels, explicit tracing provenance and missing physical calibration. The study supplies a reproducible geometric replacement for ambiguous legacy figures while reserving taxonomic and biological comparisons for independently reviewed, comparable specimens.
The source photograph, 2023BaViNematode9(3).jpg, contains 1600 by 1200 pixels. We designate two apparent bright rims R1 and R2 and preserve their crop bounds and vertices in the original image coordinate system. The archive places these images in a nematode series with rays and spicules, but that context does not by itself determine the identity of each traced contour. We retain the visible microscope pointer and do not remove optical artifacts or complete boundaries through obscured regions.
The legacy annotation versions move labels without establishing an independent anatomical determination. The old figure labels central_cap and left_large_cap also lack a complete source-coordinate mapping. We therefore do not carry their numerical values into the current results. A source registration links one enlarged circular-profile crop to R1, but it does not establish that R2 equals either older label. Detailed Physaloptera descriptions provide comparative anatomical context, not an identification of this photograph (Gorgani et al., 2013; Macedo et al., 2023).
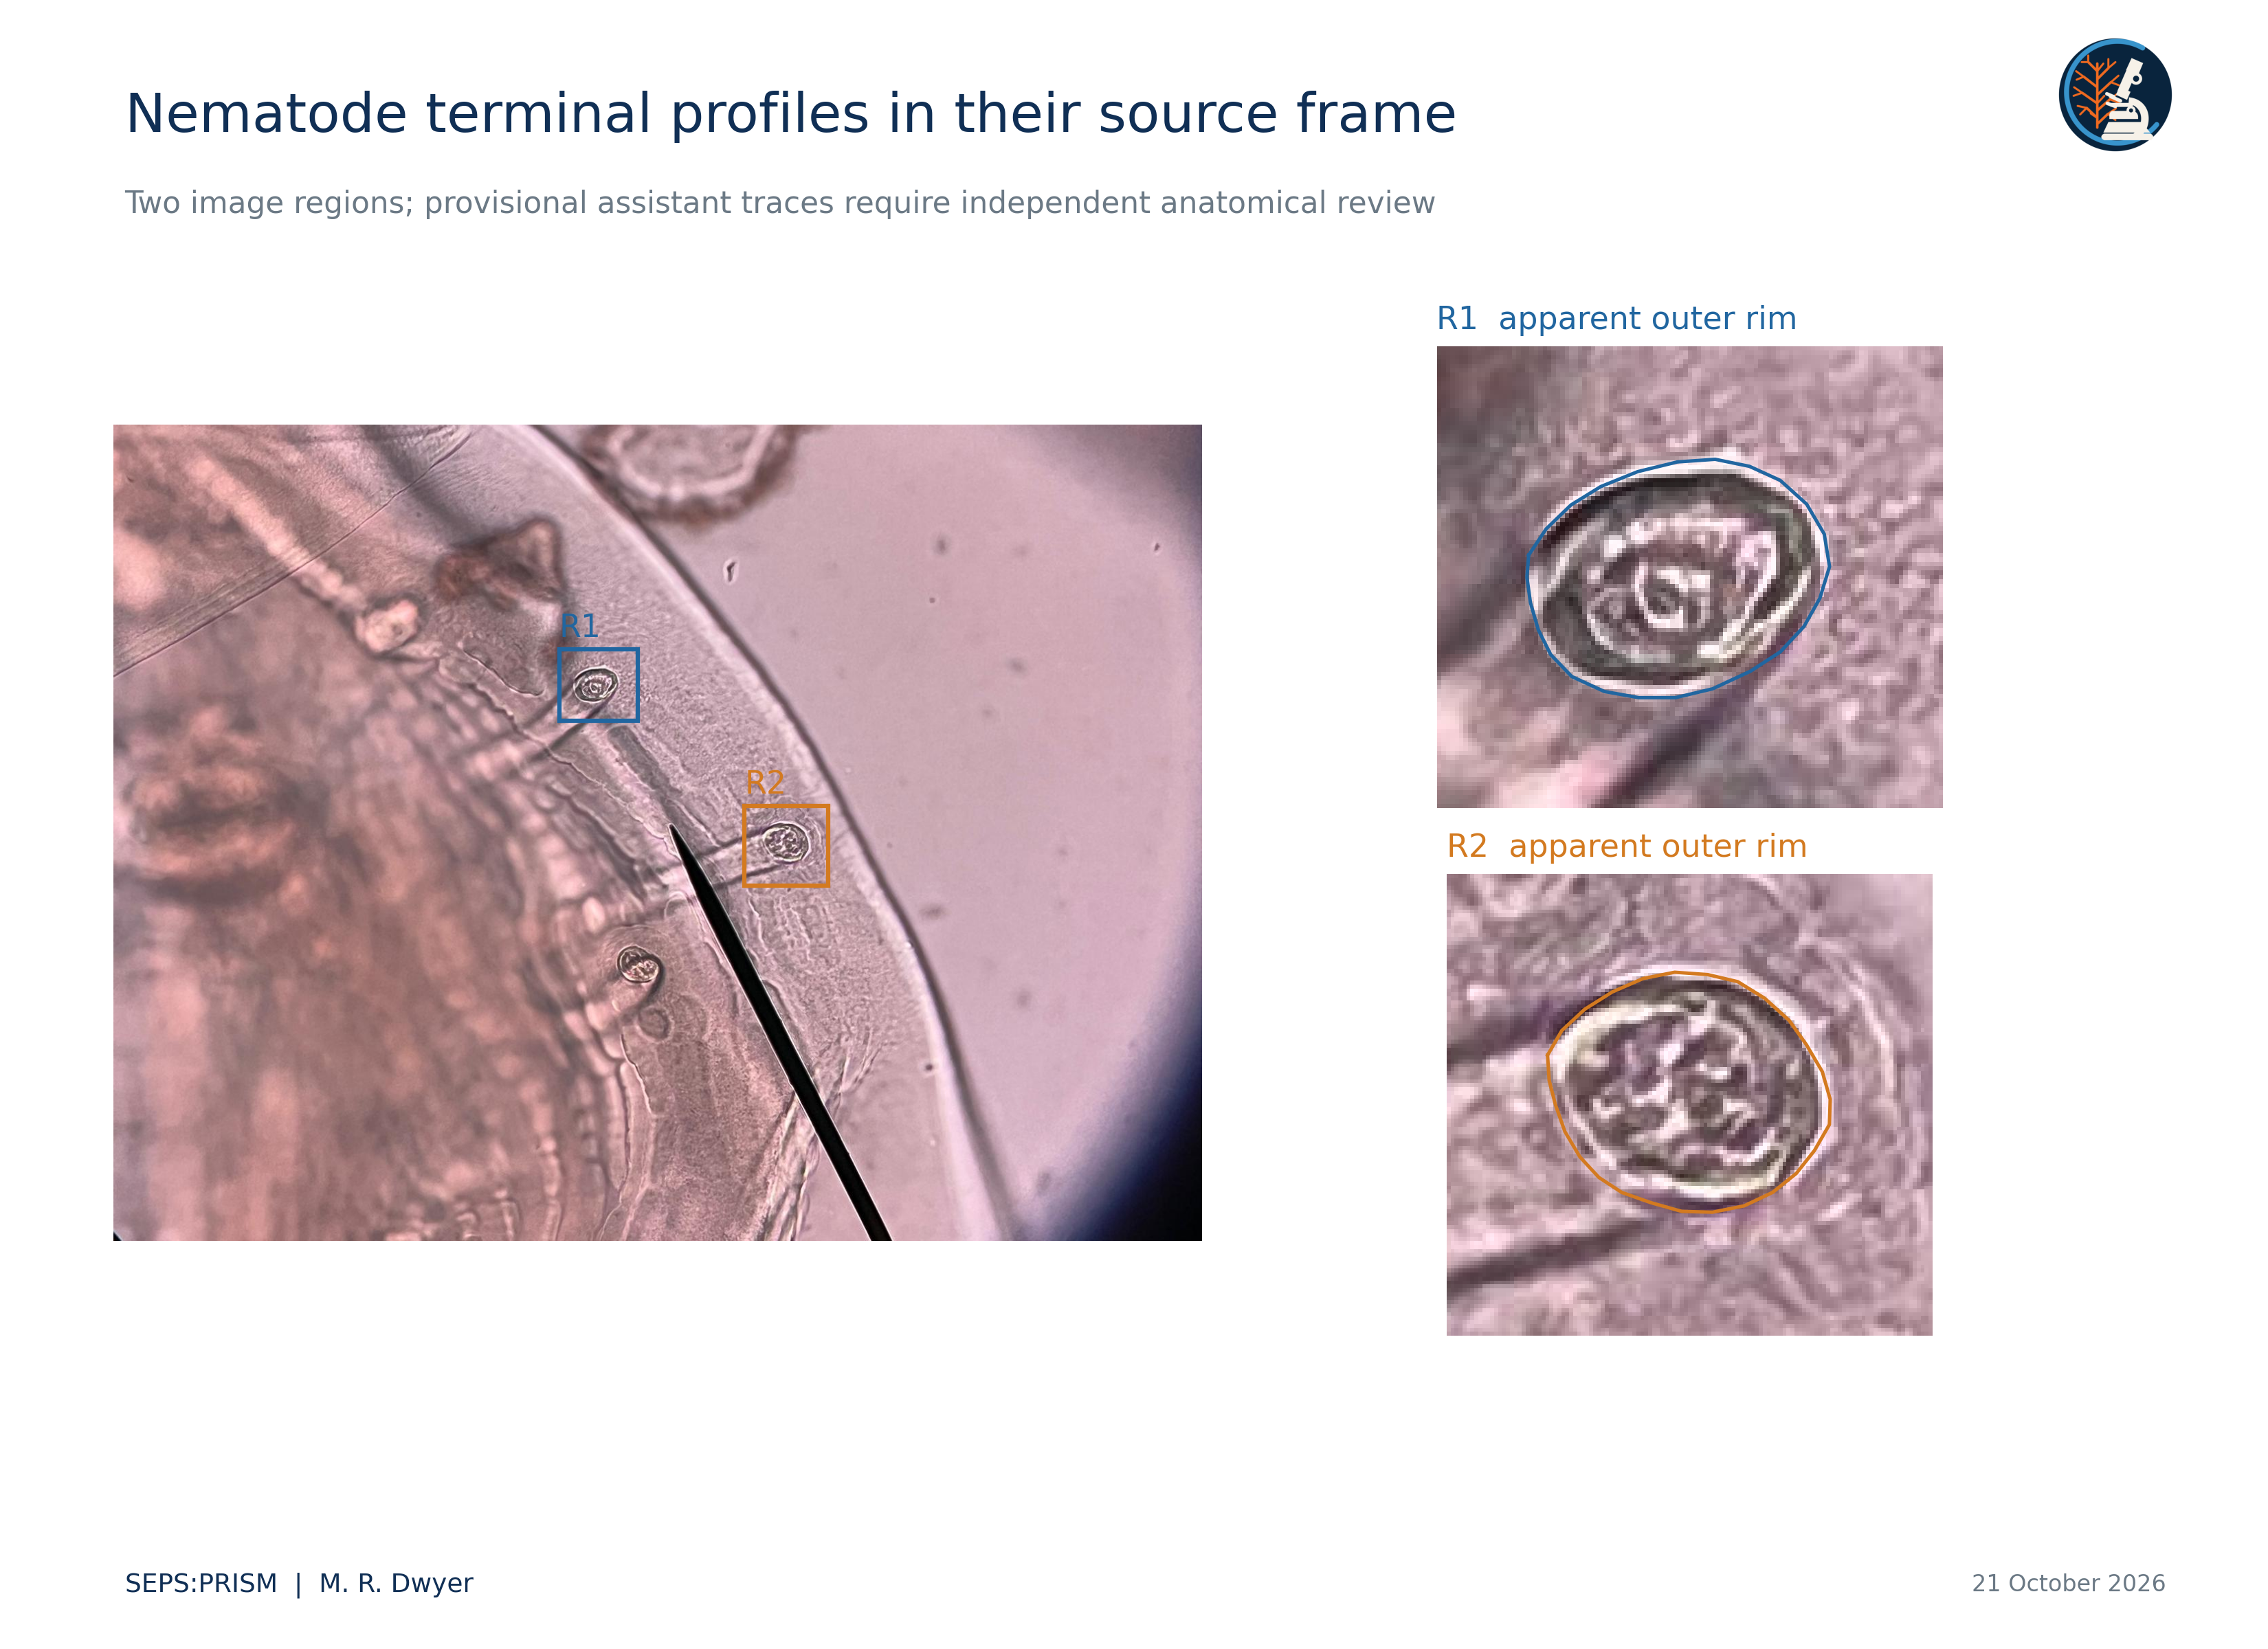
We use 25 polygon vertices for R1 and 27 for R2. The assistant initialized these vertices by inspecting the apparent outer bright rim and excluding the stalk. Straight segments connect successive vertices without smoothing. The vertices define one boundary per region; they do not constitute biological replicates. An independent reviewer must assess the chosen anatomical boundary before the measurements support a diagnostic claim.
 (1)
 (2)
We compute maximum Feret diameter from the convex hull and minimum Feret diameter from support widths perpendicular to hull edges. A and P determine circularity C and area-equivalent diameter D_A. Feret ratio F measures elongation in this geometric sense and does not equal ellipse eccentricity.
Table 1. Measurements from the saved polygons
| Descriptor | R1 | R2 |
|---|---|---|
| Vertices | 25 | 27 |
| Area in pixels squared | 2856.20 | 3292.88 |
| Perimeter in pixels | 193.05 | 205.84 |
| Maximum Feret in pixels | 68.84 | 73.54 |
| Minimum Feret in pixels | 52.02 | 59.87 |
| Equivalent diameter in pixels | 60.30 | 64.75 |
| Circularity | 0.963065 | 0.976649 |
| Feret ratio | 1.323276 | 1.228296 |
All values describe the uploaded JPEG grid. No physical units or between-specimen inference follow from these data.
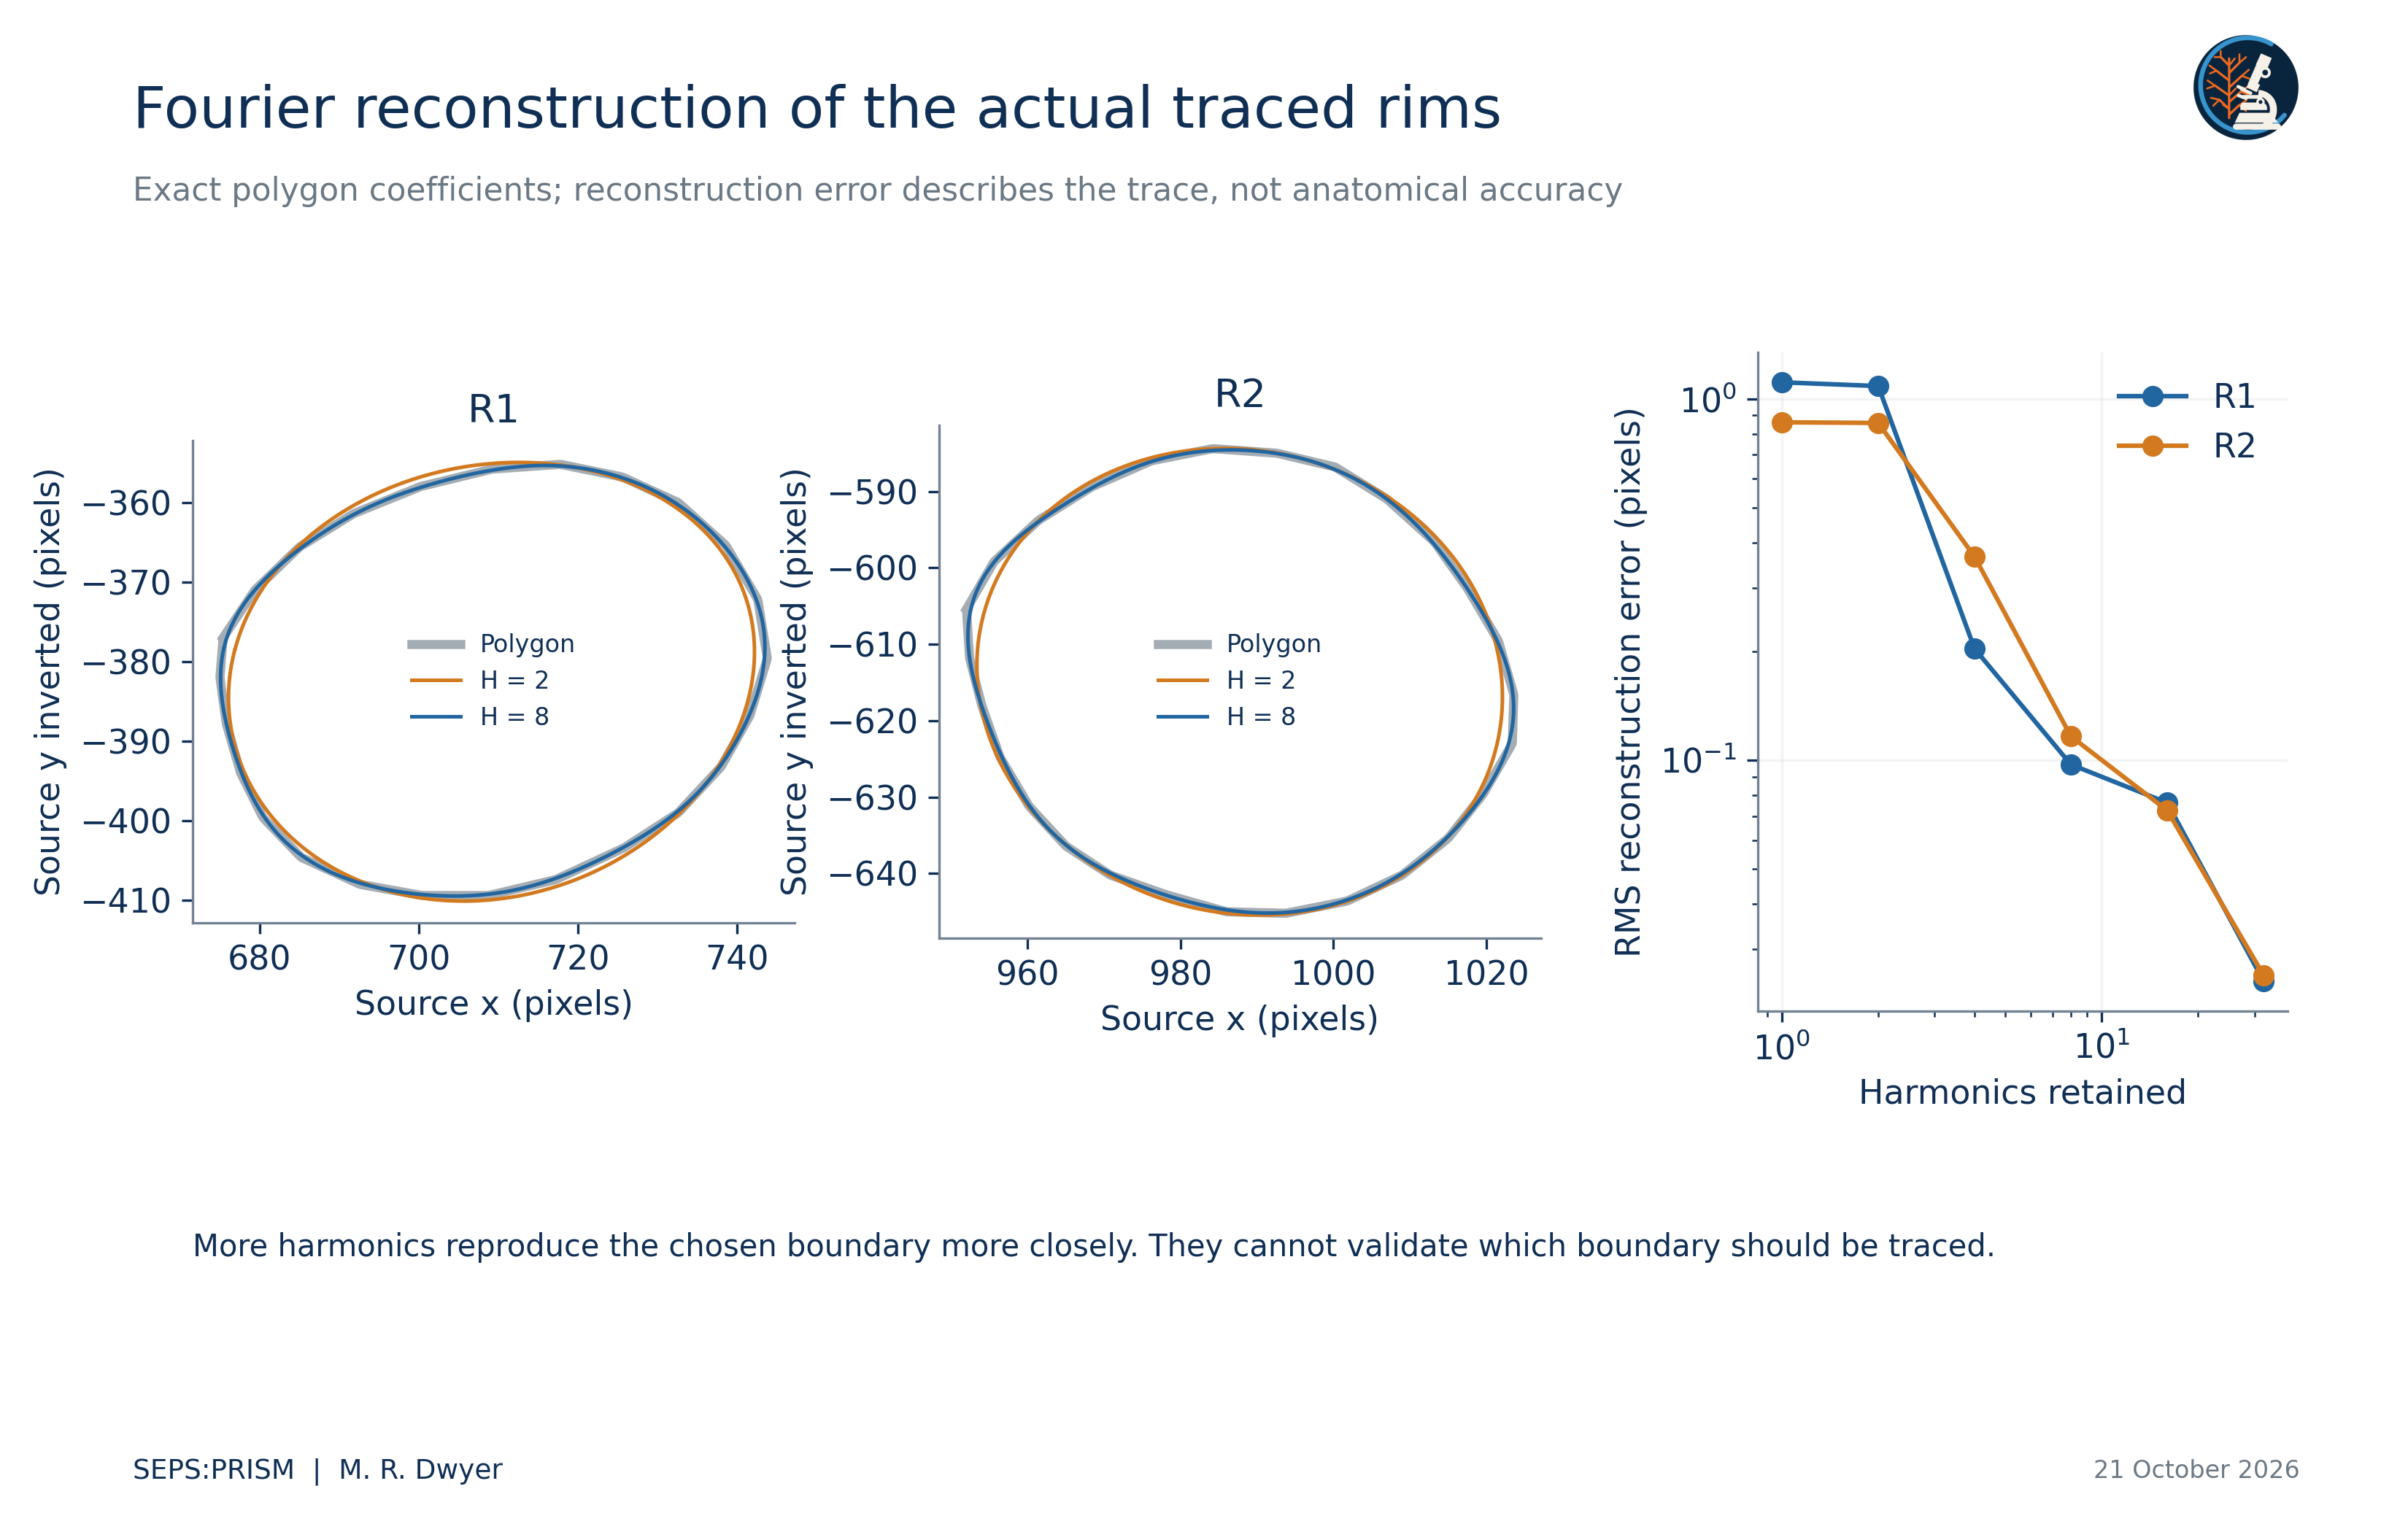
We apply the elliptic Fourier representation of Kuhl and Giardina (1982) to the actual polygons. We parameterize each segment by its Euclidean length so that the traversal speed remains constant. We calculate coefficients by exact integration over the piecewise-linear curve and compare reconstructions with the polygon at 512 equal perimeter intervals. This computation replaces an abstract demonstration curve with the source-linked profiles themselves.
 (3)
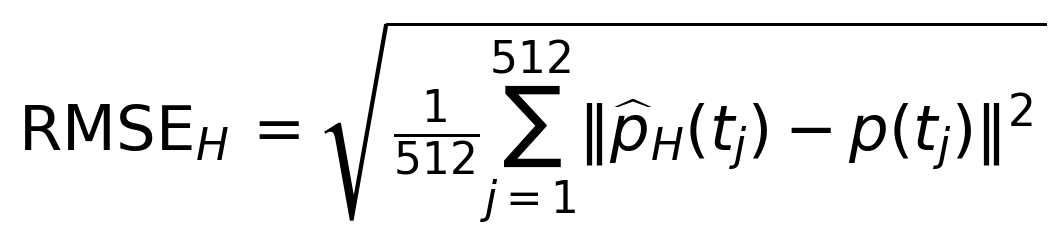 (4)
We use the same phase origin for the polygon and reconstruction. The accompanying coefficients table stores all 32 harmonics, constant terms and region identifiers. The methods report gives the exact segment-integral expressions.
For R1, reconstruction error decreases from 1.1103 source pixels at one harmonic to 0.2034 at four, 0.0973 at eight and 0.0245 at 32. For R2, the corresponding values equal 0.8606, 0.3656, 0.1164 and 0.0254 pixels. High harmonic order reproduces the polygon more closely but cannot establish that the polygon follows the correct structure. The subpixel numerical residuals do not imply subpixel optical resolution.
We center each outline at its polygon area centroid, invert the image y-axis, and estimate its major axis from 256 equally spaced perimeter samples. We rotate the outline to that axis without reflection and divide coordinates by the square root of polygon area. Each displayed outline then has unit area. A principal-axis convention leaves a 180-degree ambiguity and does not establish biological correspondence between arbitrary boundary points.
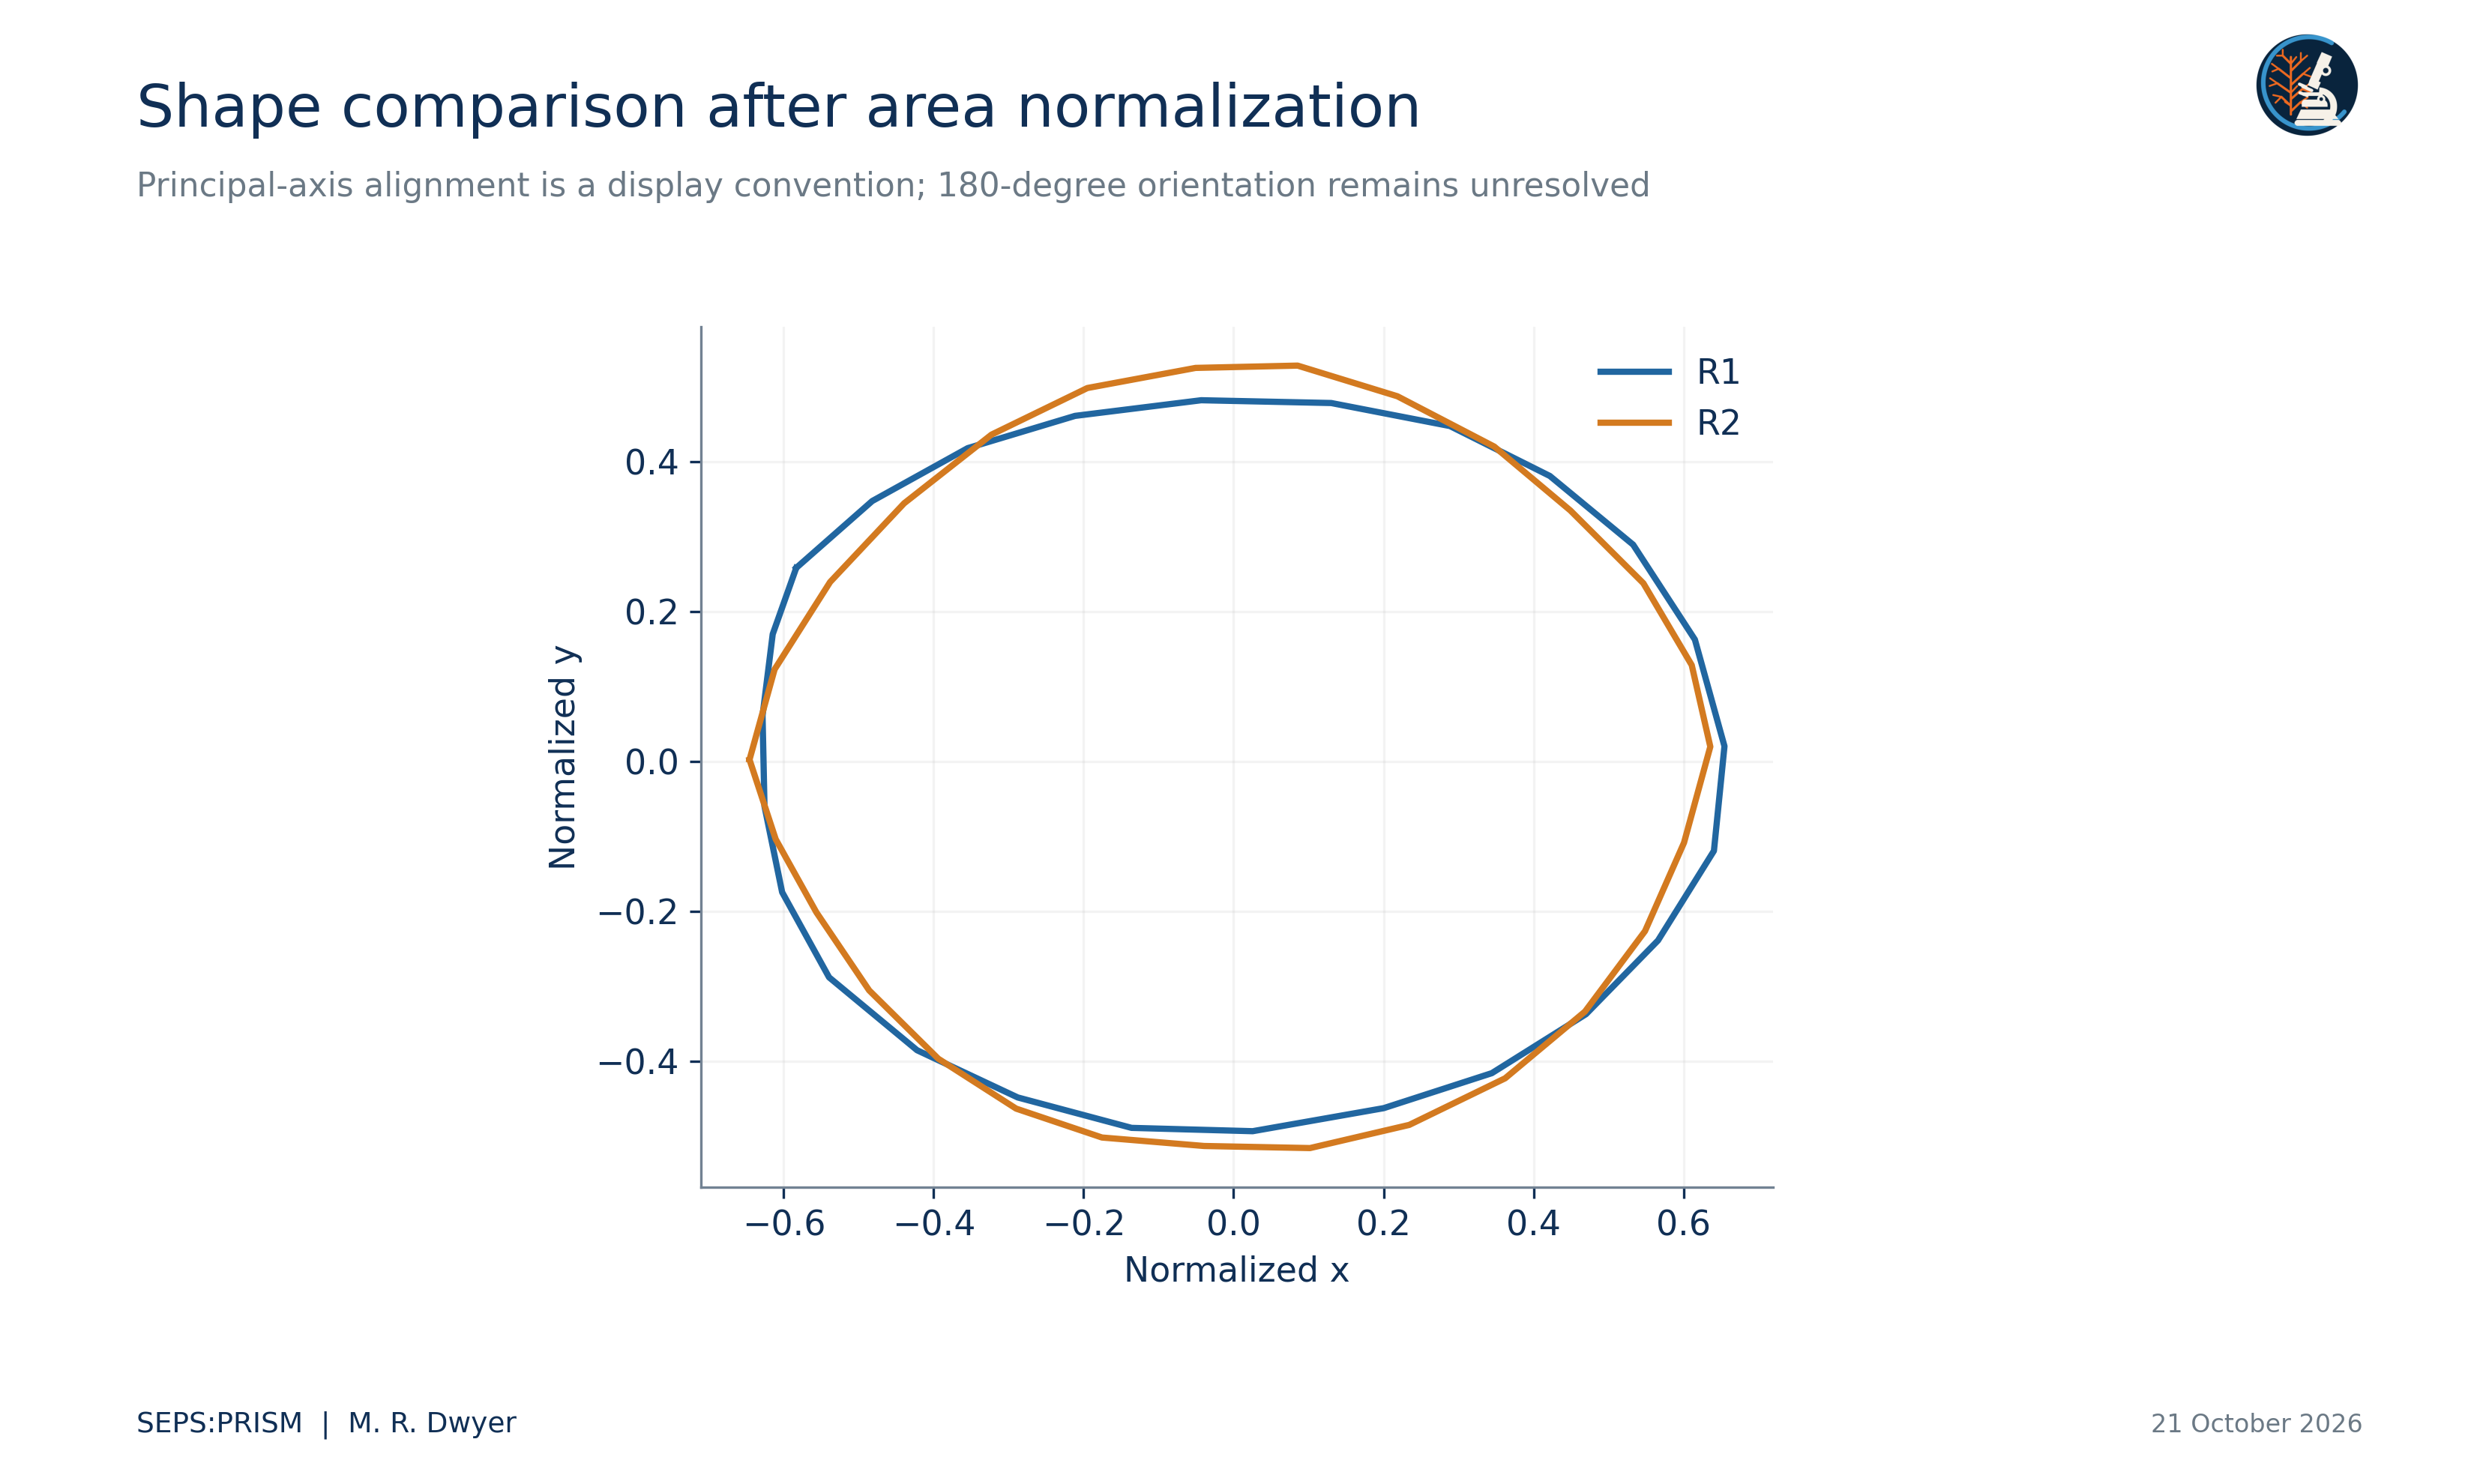
 (5)
We perturb each vertex radially relative to the polygon centroid c. This operation differs from a normal offset of a curved boundary. The resulting range illustrates one sensitivity scenario; it does not incorporate uncertainty from blur, illumination, optical projection, boundary definition or reviewer disagreement.
R2 covers more image area and has a lower Feret ratio than R1 under the chosen traces. Both profiles look nearly circular under these descriptors. We do not infer a species difference, a sex difference or independent specimen replication from two regions in one frame. Nor do we infer physical dimensions from the apparent similarity of imaging conditions. We retain image geometry as image geometry until source calibration and anatomical review support a stronger claim.
A useful next study would sample anatomically corresponding structures from separately identified specimens, obtain repeat traces from independent reviewers, preserve orientation and preparation, and test the added value of descriptors against conventional diagnostic characters. We would split evaluation data by specimen and, where appropriate, host and acquisition source. The current data and code provide a reproducible starting point for that study rather than a validated identification system (Dwyer, 2026a).
Independent calculations reproduced both polygon metrics, all 32 harmonic coefficient sets and the six reported reconstruction errors per region. Midpoint quadrature at 262144 perimeter positions agreed with the exact-segment coefficients within 0.0000002 source pixels. The saved polygons contain no crossing nonadjacent segments. These checks establish consistency for the declared traces. They leave anatomical identification and boundary placement as separate questions. We therefore release the analysis as a reproducible profile experiment in source pixels, with R1 and R2 as region identifiers.
Dwyer, M. R. (2026a). SEPS:PRISM methodology reference (Version 1.2, 18 October 2026) [Methodology specification]. Society for Evolutionary Parasite Systematics.
Gorgani, T., Naem, S., Farshid, A. A., & Otranto, D. (2013). Scanning electron microscopy observations of the hedgehog stomach worm, Physaloptera clausa (Spirurida: Physalopteridae). Parasites & Vectors, 6, 87. https://doi.org/10.1186/1756-3305-6-87
Kuhl, F. P., & Giardina, C. R. (1982). Elliptic Fourier features of a closed contour. Computer Graphics and Image Processing, 18(3), 236–258. https://doi.org/10.1016/0146-664X(82)90034-X
Macedo, L. C., Willkens, Y., Silva, L. M. O., Gardner, S. L., Melo, F. T. V., & Santos, J. N. (2023). “Revisiting the past”: A redescription of Physaloptera retusa (Nemata, Physalopteridae) from material deposited in museums and new material from Amazon lizards. Revista Brasileira de Parasitologia Veterinária, 32(2), e017422. https://doi.org/10.1590/S1984-29612023016