 SEPS
Society for Evolutionary Parasite Systematics
SEPSM. R. Dwyer
Research and technical report. No validated end-to-end identification performance claimed.
We reanalyze published Raillietiella orientalis landmark configurations while preserving host grouping and an unresolved repeated specimen identifier. The source contains 39 ten-landmark configurations, 38 printed specimen identifiers and 14 host groups across five host species. Our primary analysis excludes both configurations with the ambiguous identifier and retains 37 configurations. Generalized Procrustes alignment and PCA assign 35.08% and 20.21% of shape variance to the first two components. An exploratory comparison of equally weighted host means gives a host-label permutation p value of 0.2387. Alternative repeated-identifier decisions change that value to 0.1192, 0.1203 or 0.0993. These results concern a specifically defined secondary analysis and do not reproduce all estimands in the original publication. The study demonstrates how identity and sampling hierarchy affect a reproducible reference comparison.
Westfall et al. (2019) supplied landmark and specimen information as Supporting Information S1 and S2. We retain those files unchanged and parse their coordinates and identifiers into machine-readable tables. We use this published material as an external methodological reference. We do not relabel its specimens as SEPS collections or join them to the unlinked brightfield nematode photographs.
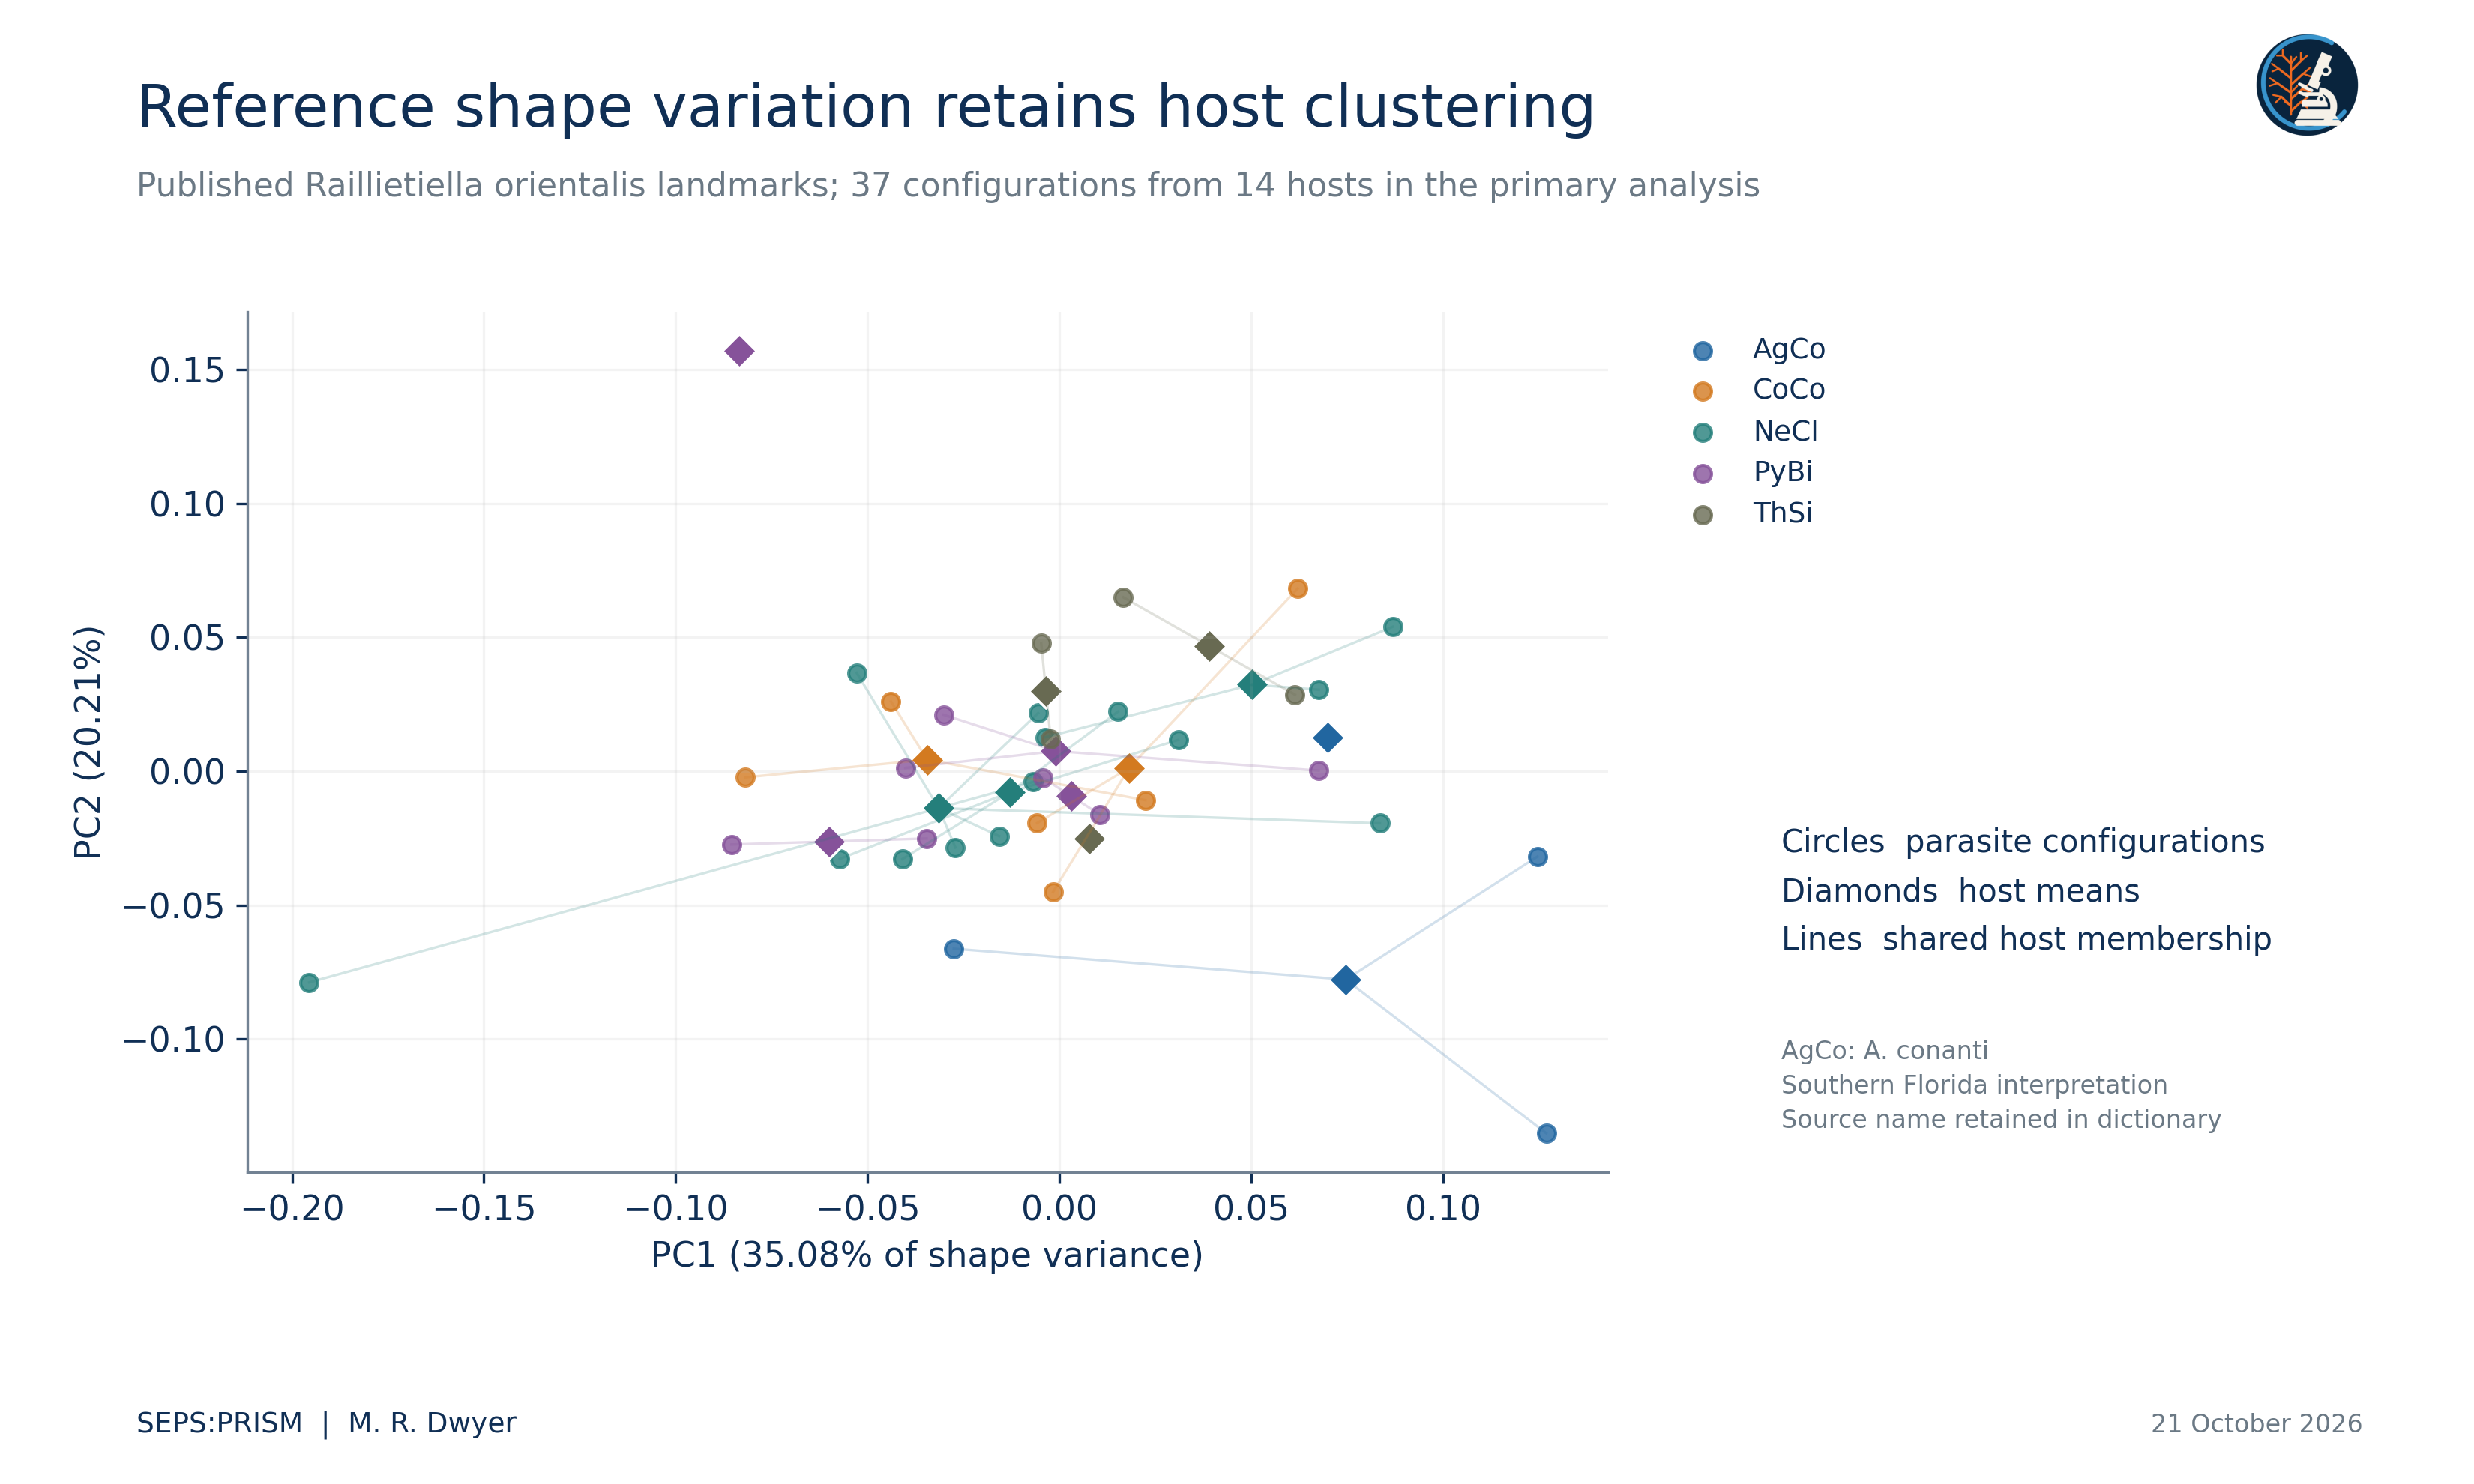
Species codes use the first two letters of the genus and specific epithet, with each pair capitalized: AgCo = Agkistrodon conanti; CoCo = Coluber constrictor; NeCl = Nerodia clarkii; PyBi = Python bivittatus; and ThSi = Thamnophis sirtalis. The wider SEPS collection also uses NeFa = Nerodia fasciata. These codes are labels, not permanent specimen identifiers.
The source labels its cottonmouth hosts Agkistrodon piscivorus (AgkPis). We use AgCo for their current taxonomic interpretation because the study reports native-snake sampling in southern Florida, sympatric with Burmese pythons (Westfall et al., 2019), within the range of Agkistrodon conanti recognized by Burbrink and Guiher (2015). This geographic interpretation is not an independent voucher redetermination. Original source names and codes remain in separate fields and in Host_Code_Dictionary.csv; printed specimen IDs and image filenames remain verbatim. This relabeling changes no coordinates, host memberships or analytical comparisons.
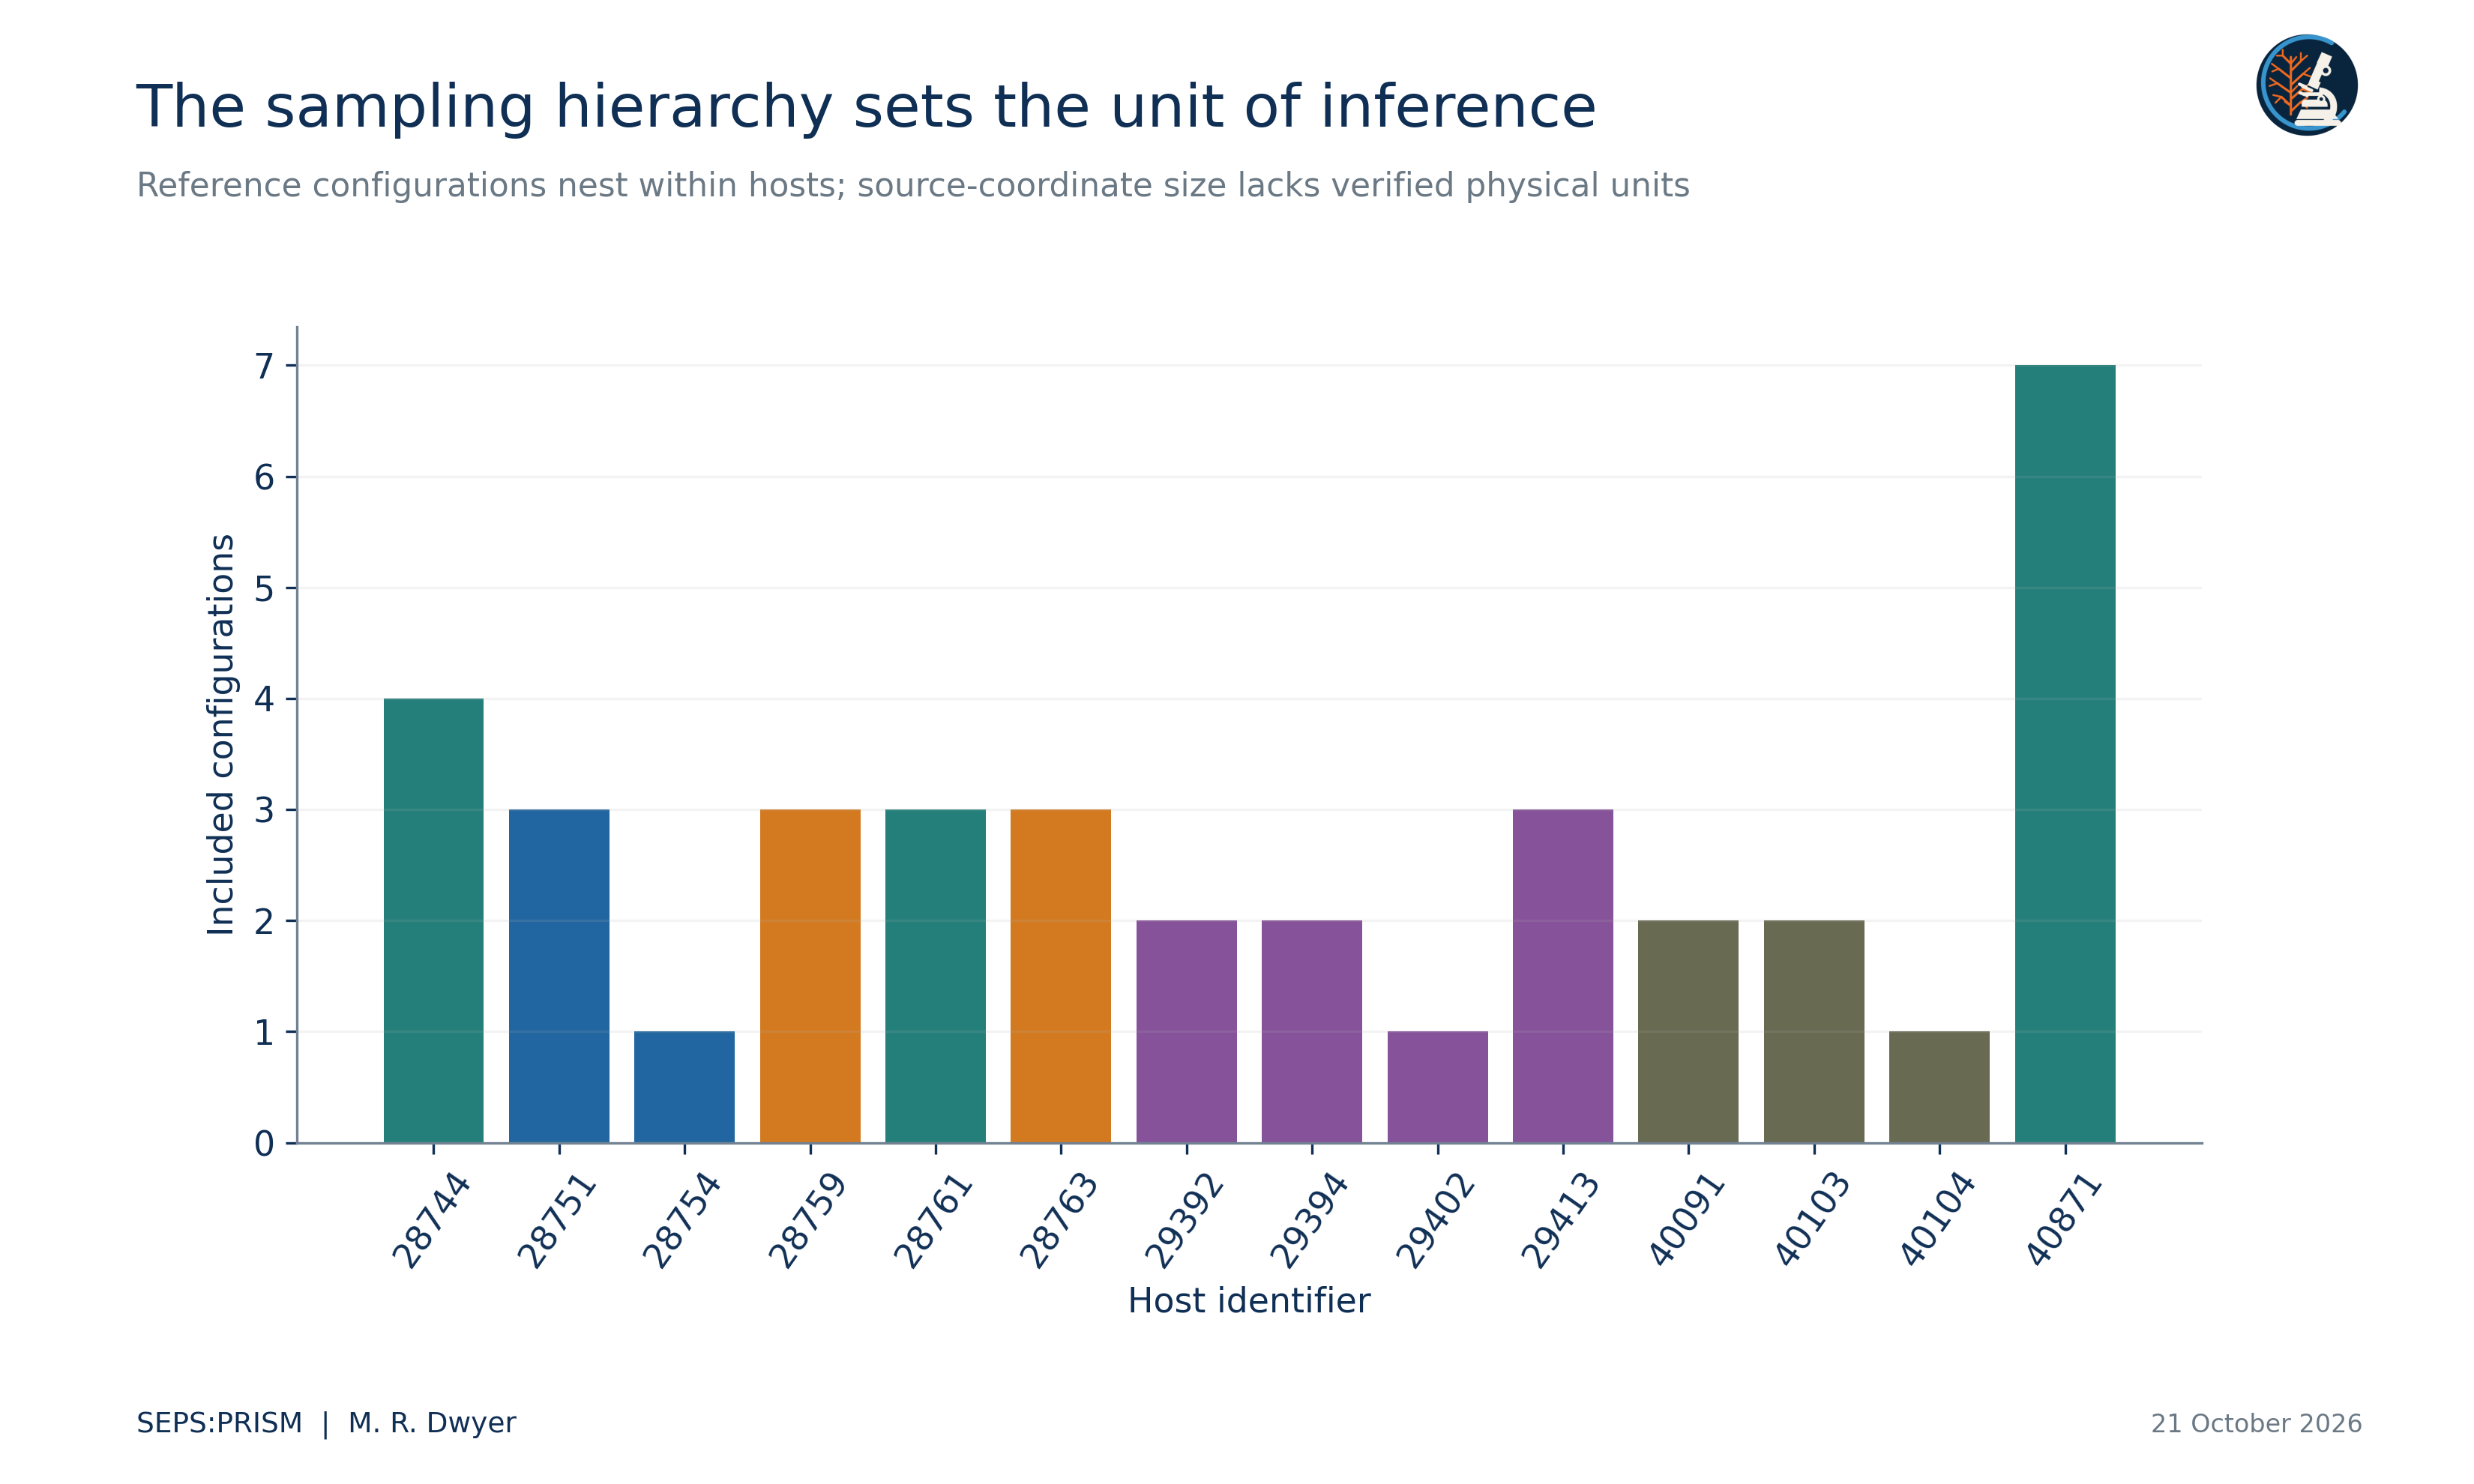
The source contains 39 configurations with ten two-dimensional landmarks each, totaling 390 coordinate pairs. One printed specimen identifier, 29402_A_PytMol, appears with two different image filenames. We cannot resolve whether those records represent repeated views, distinct specimens or a labeling error from the supplementary files alone. Our primary analysis excludes both ambiguous entries, and sensitivity analyses retain either one or both. All alternatives retain the 14 host groups because another configuration represents the affected host.
 (1)
 (2)
We center and scale each configuration, then solve the rotational alignment by singular-value decomposition with a determinant correction that excludes reflection. We update the consensus M and iterate to convergence. This follows the generalized Procrustes framework (Gower, 1975). The primary calculation converges in six iterations.
 (3)
We vectorize aligned coordinates and center them across configurations to form Y. PCA diagonalizes their covariance S. The variance fraction of component j equals λ_j divided by the sum of eigenvalues. The source-coordinate centroid size remains separate from shape; its physical unit remains unverified despite the numeric TPS scale entries.
 (4)
 (5)
We average configurations within each host, then assign equal weight to the H = 14 host means. G = 5 denotes host-species groups and H_g their host counts. We permute species labels over host means rather than permute individual parasite configurations. This procedure assumes host exchangeability under the null and does not control unmeasured collection, preparation or host-trait differences.
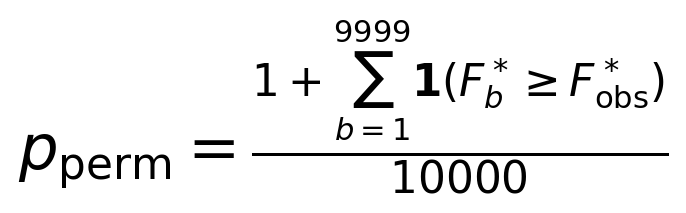 (6)
The plus-one convention includes the observed arrangement in the randomization reference. We keep the random seed and permutation count in the analysis code. The result describes this host-mean comparison and does not estimate a taxonomic classifier accuracy.
The primary PCA assigns 35.0837% of shape variance to PC1 and 20.2111% to PC2. The host-mean comparison yields R² = 0.36136, pseudo-F = 1.27312 and p = 0.2387. These values do not establish absence of a host association; the small, unevenly replicated host groups and unmodeled covariates limit that inference. The first two axes summarize 55.29% of configuration-level shape variation and leave substantial variation outside the plotted plane.
Table 1. Repeated identifier alternatives
| Identity decision | Configurations | Permutation p |
|---|---|---|
| Exclude both ambiguous entries | 37 | 0.2387 |
| Retain first entry | 38 | 0.1192 |
| Retain second entry | 38 | 0.1203 |
| Retain all entries | 39 | 0.0993 |
All four scenarios retain 14 hosts. Each calculation uses 9,999 host-label permutations and equal host weighting. The alternatives express unresolved identity rather than researcher-selected significance thresholds.
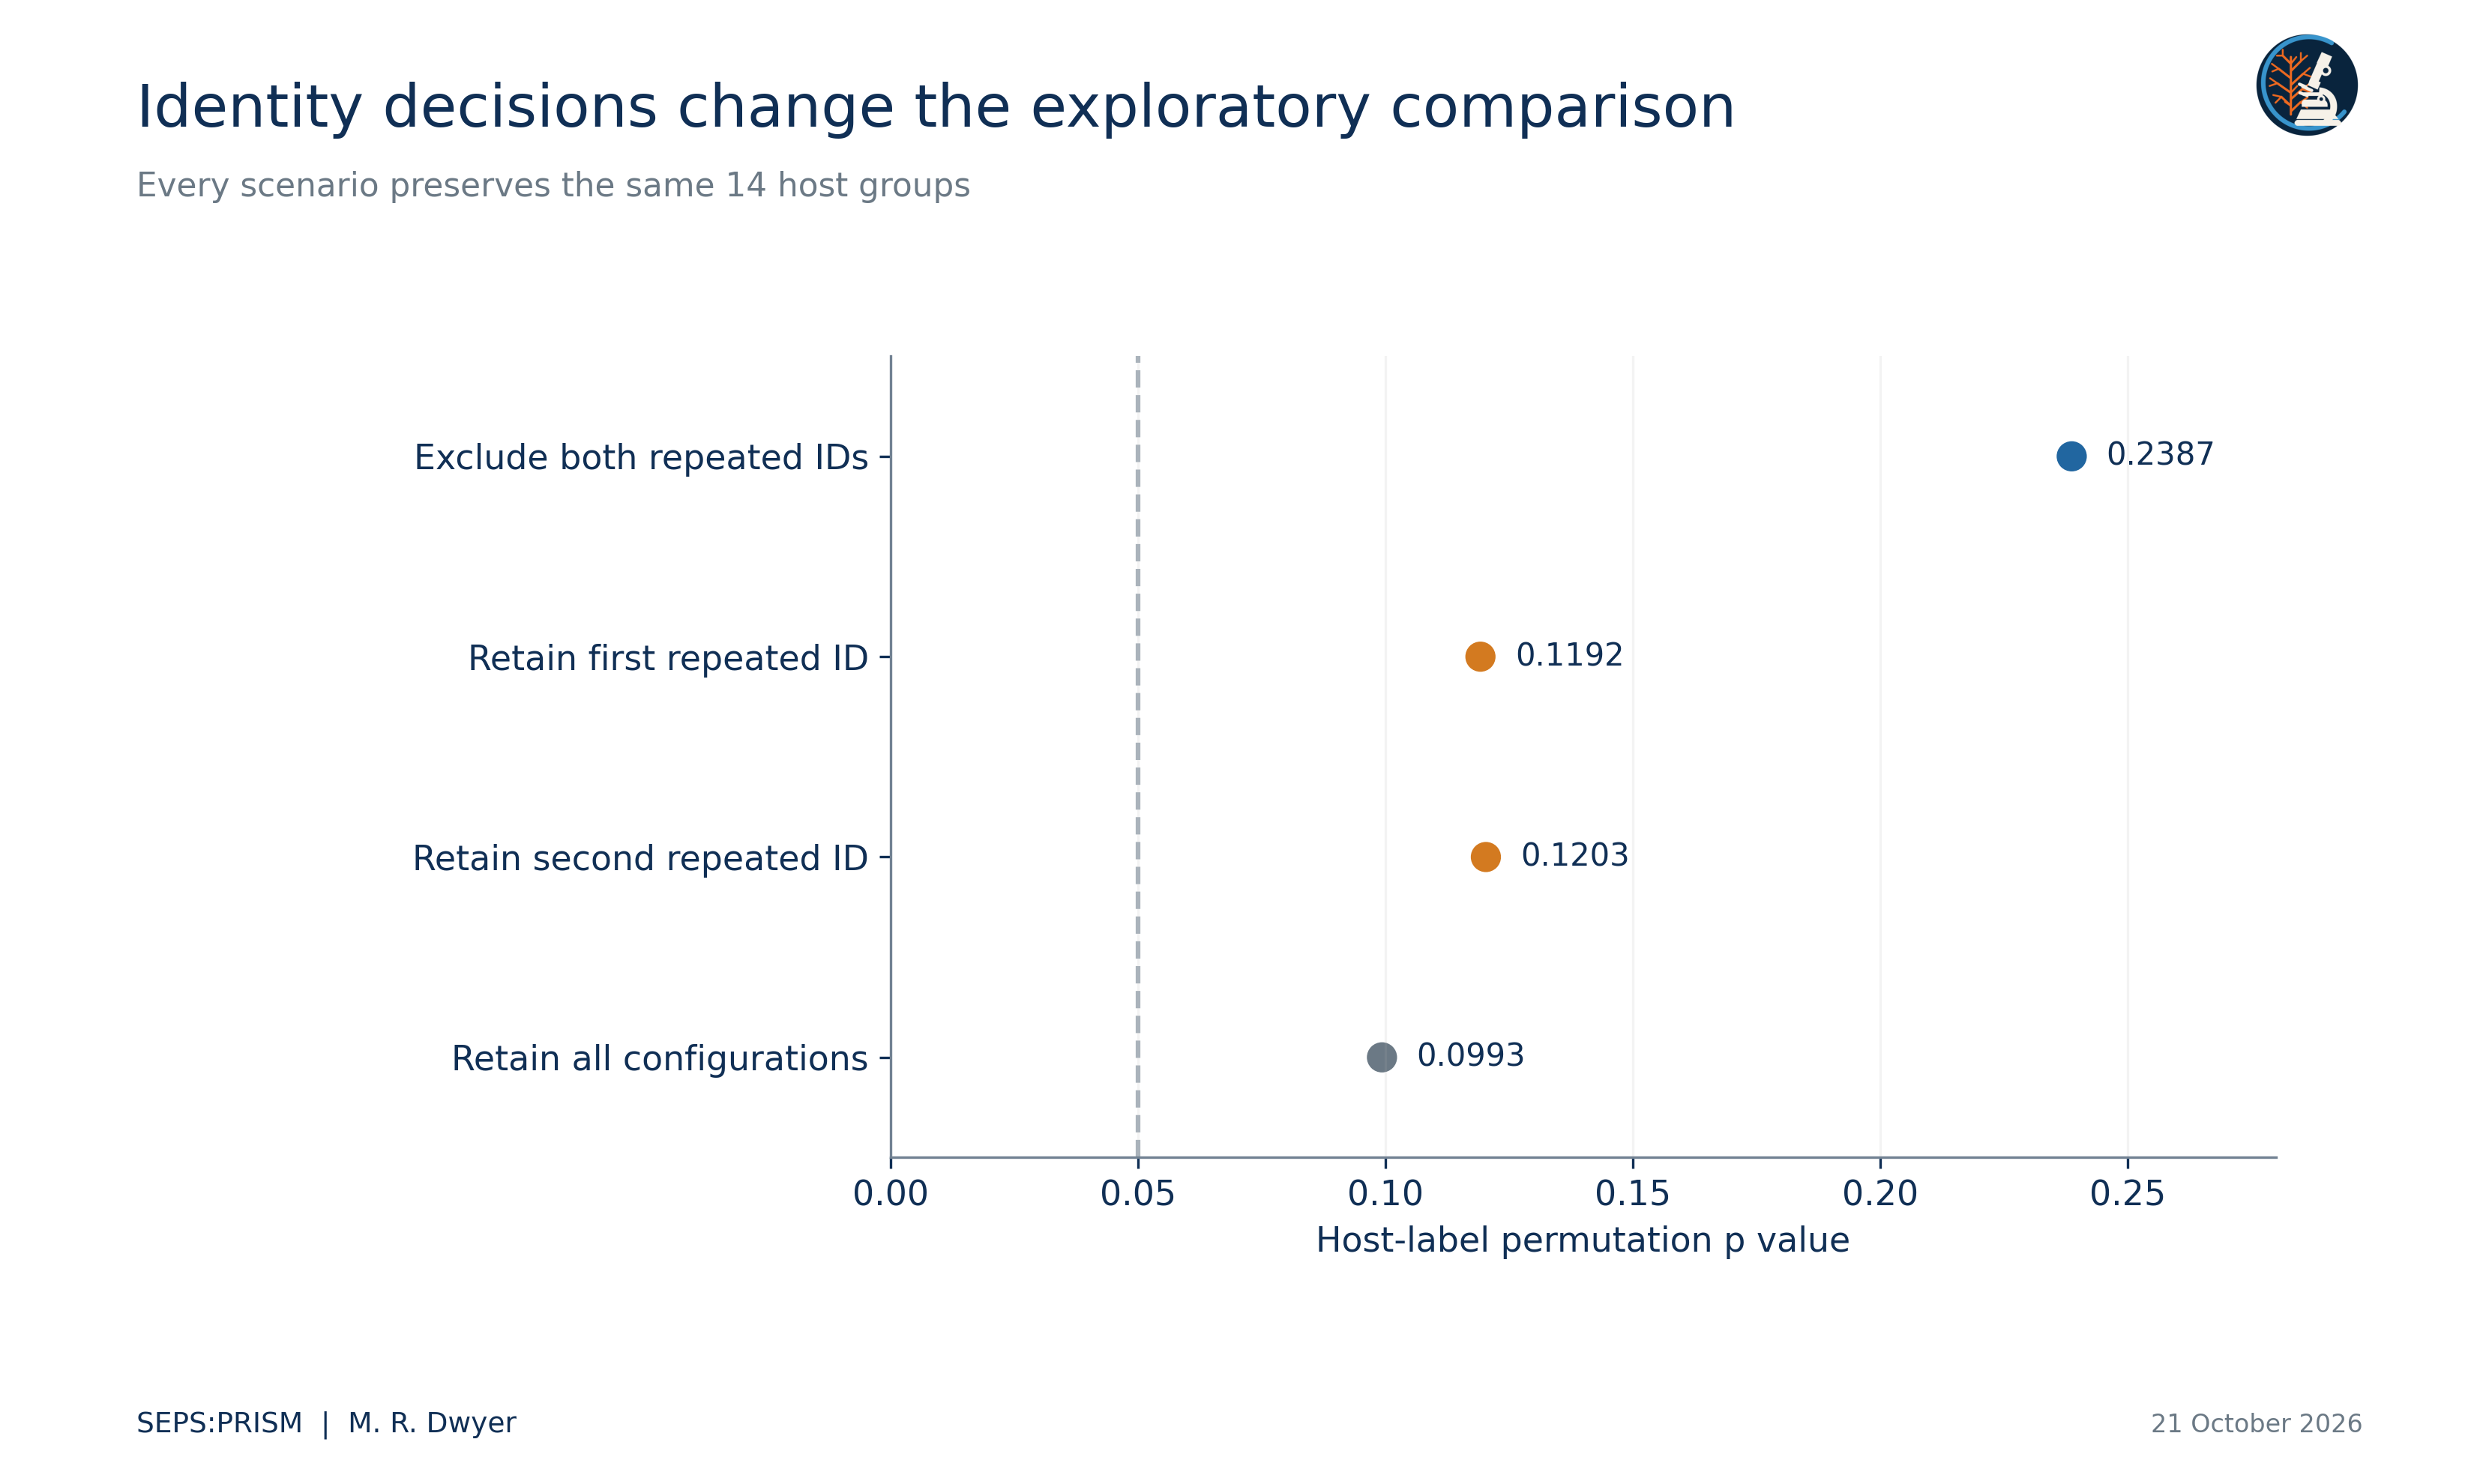
The two ambiguous configurations have source-coordinate centroid sizes of 535.0649 and 540.0472 pixels and a Procrustes distance of approximately 0.02123. Their geometric similarity does not resolve specimen identity. Retaining both adds two configurations associated with one printed identifier and changes the weighting of that host mean. We therefore preserve all four scenarios instead of choosing the result that looks strongest.
A reference collection gains value when users can distinguish image records, individual parasites and host replicates. The present reanalysis makes those distinctions computationally explicit. It also shows why a published calibration field requires interpretation before an analyst reports millimeters. We supply original coordinates, aligned coordinates, scores, host groups and sensitivity results so that another analyst can inspect each step.
The analysis does not overturn the original study or reproduce all of its comparisons. Different sampling units, covariates and identity choices define different questions. Before a new biological claim, we would resolve the repeated identifier with the original data custodians, verify calibration from the original images and evaluate measurement repeatability. SEPS:PRISM preserves those dependencies in the evidence record rather than hiding them behind a single shape plot (Dwyer, 2026a).
An independent implementation used analytic two-dimensional rotations instead of the production singular-value rotation and reconstructed all four identity scenarios. The coordinate variances, host-level sums of squares and 9999 seeded permutations reproduced the saved results within the supplied tolerances. We include the determinant correction in the rotation equation so that the manuscript matches the code and excludes reflections. Host-label exchangeability remains an exploratory sampling assumption. The repeated specimen identifier remains unresolved; numerical agreement does not select one of its coordinate sets.
Burbrink, F. T., & Guiher, T. J. (2015). Considering gene flow when using coalescent methods to delimit lineages of North American pitvipers of the genus Agkistrodon. Zoological Journal of the Linnean Society, 173(2), 505–526. https://doi.org/10.1111/zoj.12211
Dwyer, M. R. (2026a). SEPS:PRISM methodology reference (Version 1.2, 18 October 2026) [Methodology specification]. Society for Evolutionary Parasite Systematics.
Gower, J. C. (1975). Generalized Procrustes analysis. Psychometrika, 40(1), 33–51. https://doi.org/10.1007/BF02291478
Westfall, A. K., Miller, M. A., Murray, C. M., Falk, B. G., Guyer, C., & Romagosa, C. M. (2019). Host-specific phenotypic variation of a parasite co-introduced with invasive Burmese pythons. PLOS ONE, 14(1), e0209252. https://doi.org/10.1371/journal.pone.0209252