 SEPS
Society for Evolutionary Parasite Systematics
SEPSM. R. Dwyer
Research and technical report. No validated end-to-end identification performance claimed.
We reconstruct a 33-row host-count transcription and distinguish the questions it can answer from those that require examination-level evidence. The archive contains 28 cottonmouth records with 178 recorded parasites and five banded watersnake records with two. Sixteen cottonmouth rows and one watersnake row contain positive values. Two cottonmouth rows account for 57.3% of the cottonmouth count. We recalculate denominator-specific summaries, conditional uncertainty, count concentration and leave-one-record-out influence. We also reconcile the separate 26-row county summary and the positive lizard series without pooling their observational units. We develop a specimen-linked ecological analysis that separates detection, burden, coinfection and transmission. The resulting data and figures provide reproducible descriptive findings while leaving population prevalence, taxon-specific interaction and geographic risk unresolved.
The South Florida program asks how parasite identity, host use and recovery site vary across a changing community of native and introduced vertebrates. Published work documents spillover of Raillietiella orientalis into native snakes and spread beyond the invasive python distribution (Miller et al., 2018, 2020). Walden et al. (2020) also documented infection in a free-ranging banded watersnake in north-central Florida. These studies motivate linked host and parasite records. They do not determine the identity of unreviewed organisms in the present archive.
We analyze the complete host-load transcription in Appendix A of the supplied SEPS synthesis (Dwyer, 2026b). We preserve its 33 identifiers and values. The archive does not establish a complete examination denominator for each organ or taxon. Some low counts may encode earlier vial conventions rather than exact enumeration. We therefore call the values recorded counts and distinguish a zero-valued row from a verified negative examination. We retain the manuscript source and each numerical transformation in the companion data folder.
 (1)
Here N counts inventory rows, n_+ counts positive rows and C sums their recorded values. These definitions do not assert that each row represents an eligible, fully examined host for every parasite target.
 (2)
Under verified eligibility and a specified parasite target, the corresponding quantities describe prevalence, mean intensity and mean abundance, respectively (Bush et al., 1997). We retain the restricted labels positive-row fraction, positive-row mean and all-row mean for the present archive. When n_+ = 0, the positive-row mean remains undefined.
We preserve the five-row NeFa inventory rather than silently substitute the older four-host statement. We likewise preserve all 28 AgCo rows rather than use the separate 26-row county denominator. An identifier match such as AgCo21 does not prove that an archival whole-host count and a later stomach case describe the same counting event. The case manuscript reports seven recognized forms, whereas the transcription assigns AgCo21 a value of one. We retain both sources and withhold a numerical merge until specimen and examination records establish their relationship (Dwyer, 2026b, 2026d).
 (3)
We set z = 1.95996398454 for the conditional 95% Wilson interval (Wilson, 1927). The interval assumes a comparable binomial sampling process. It does not absorb unidentified taxa, imperfect examination, dependent collection events or uncertain zero values.
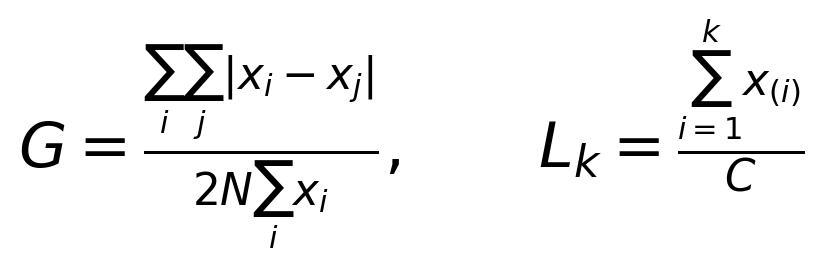 (4)
We calculate Gini concentration G and the descending cumulative share L_k, where x_(i) orders counts from largest to smallest. These descriptive quantities summarize the transcription; they do not identify a mechanism of parasite aggregation.
 (5)
We calculate each leave-one-row-out mean exactly. Influence identifies records that deserve source verification. It does not justify deleting a large observation merely because the value changes the mean.
Table 1. Host count summaries
| Quantity | AgCo | NeFa |
|---|---|---|
| Inventory rows | 28 | 5 |
| Positive rows | 16 | 1 |
| Recorded total | 178 | 2 |
| Positive-row fraction | 0.571429 | 0.200000 |
| Conditional Wilson interval | 0.390708 to 0.734915 | 0.036224 to 0.624465 |
| All-row mean | 6.357143 | 0.400000 |
| Positive-row mean | 11.125000 | 2.000000 |
| All-row median | 1 | 0 |
| Sample variance | 201.275132 | 0.800000 |
| Gini concentration | 0.803371 | 0.800000 |
AgCo denotes the cottonmouth inventory and NeFa denotes the banded watersnake inventory. Display precision describes arithmetic, not biological measurement accuracy. Source: Dwyer (2026b), Appendix A.
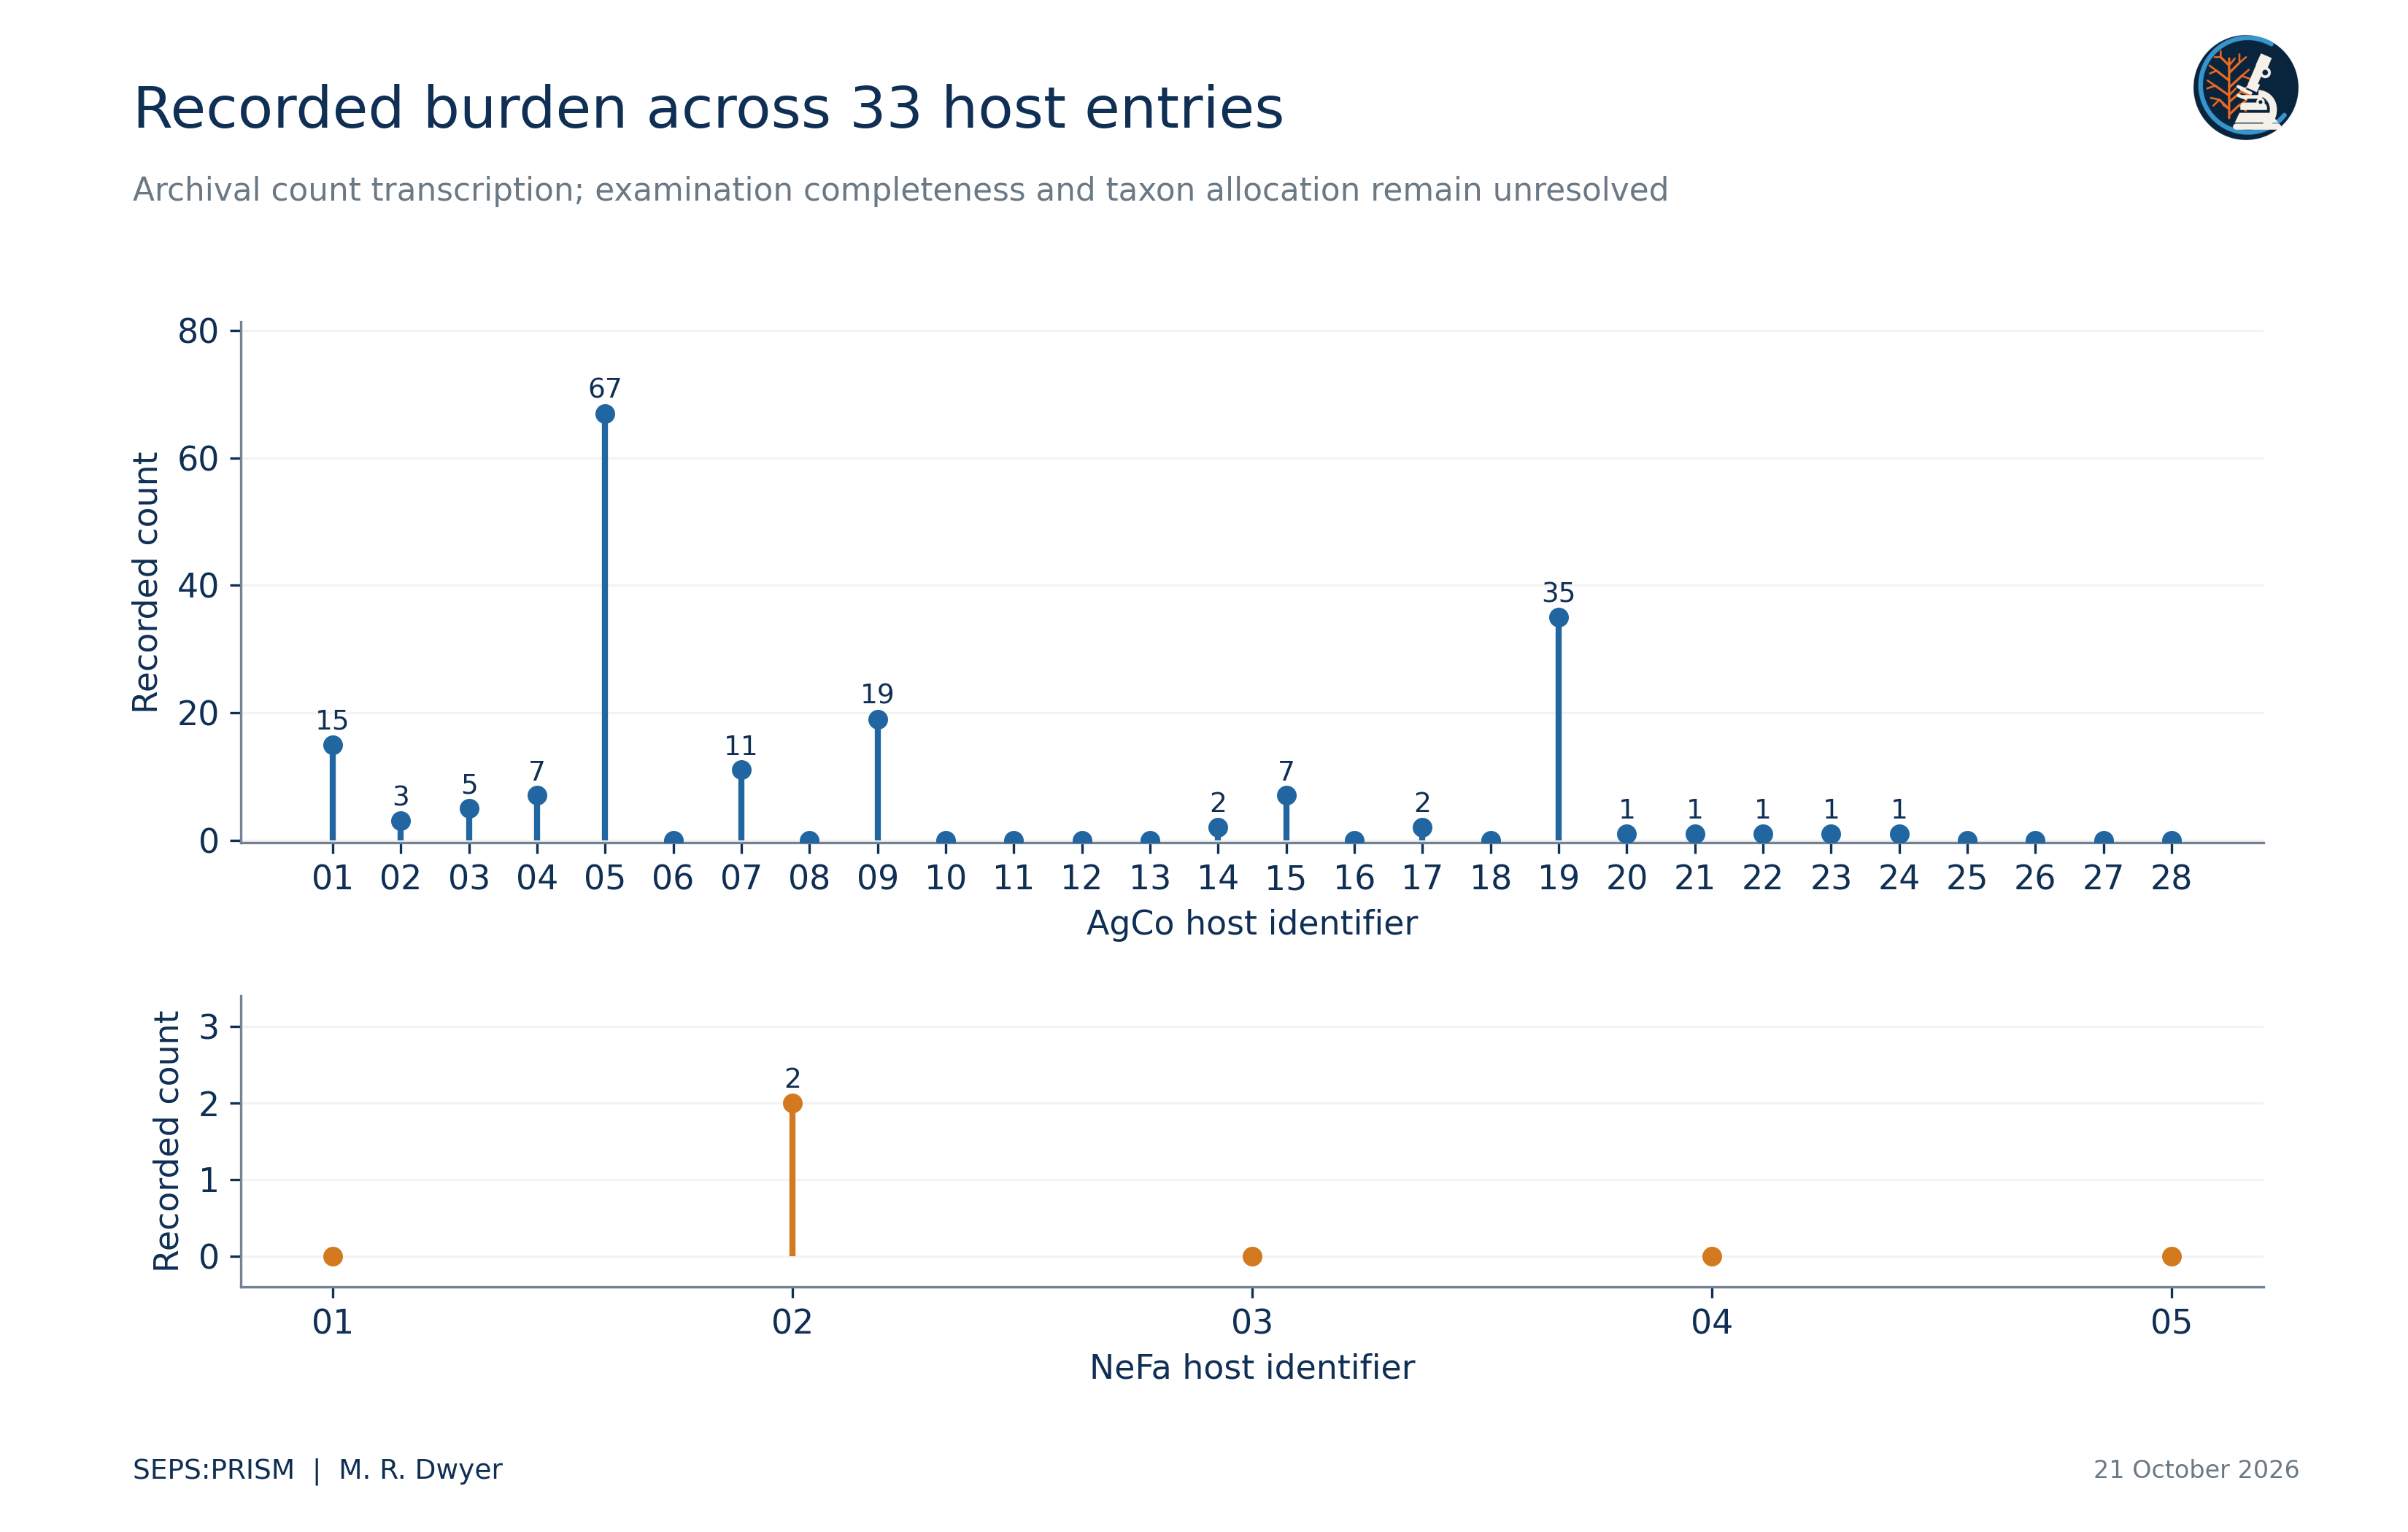
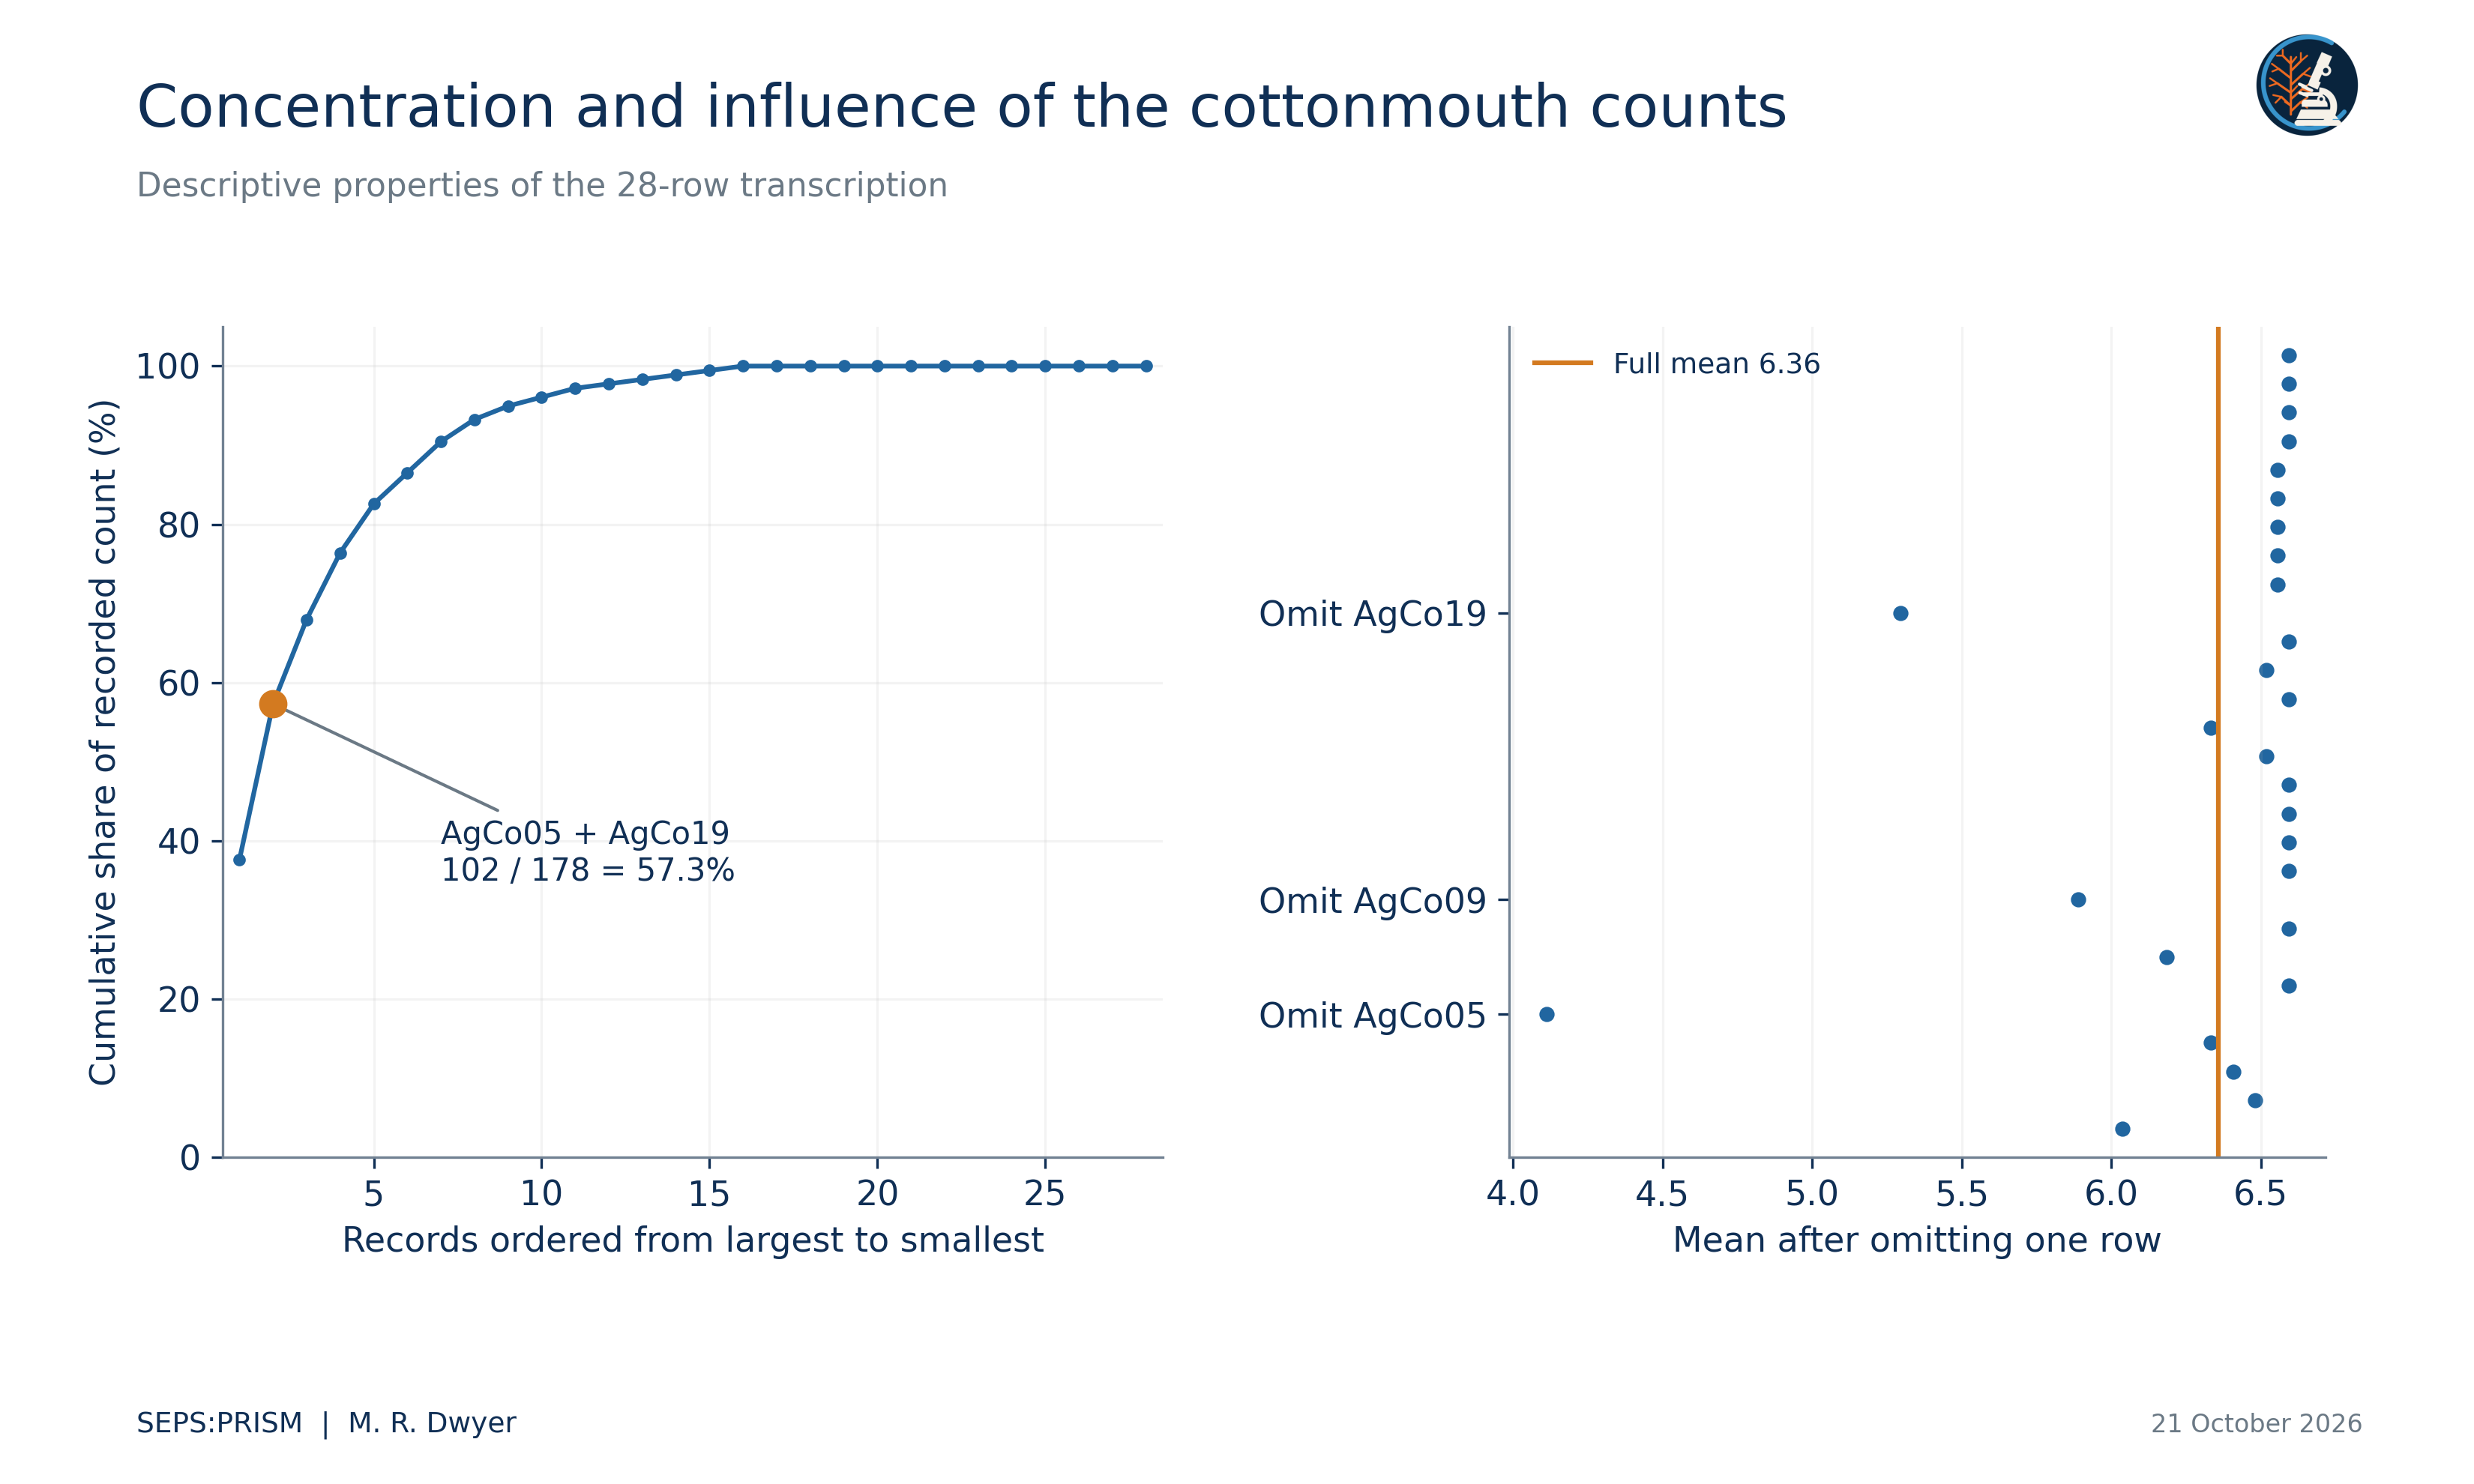
The cottonmouth transcription contains 16 positive values and 12 zeros. AgCo05 contributes 67 and AgCo19 contributes 35, for a combined 102 of 178 recorded parasites. Adding AgCo09, with 19, raises the share to 121/178, or 68.0%. The all-row median equals one, well below the all-row mean of 6.3571. The variance-to-mean ratio equals approximately 31.66. This pattern establishes heterogeneity in the recorded values, but unresolved count status prevents a strong biological interpretation of the dispersion.
Omitting AgCo05 reduces the cottonmouth mean from 6.3571 to 4.1111; omitting AgCo19 reduces it to 5.2963. We keep both observations. A future source correction should identify the original counting event and describe its consequences for these exact calculations. Substituting a smoother or less concentrated distribution would conceal the feature that most requires examination.
The watersnake transcription contains one positive row, NeFa02, with a value of two. That single row determines its entire positive-row mean. Its 20.0% positive fraction carries a conditional Wilson interval from 3.6% to 62.4%. The uncertainty and source limitations prevent an inference that watersnakes resist infection more effectively than cottonmouths. The data identify a small and incompletely characterized comparison group, not a host-competence ranking.
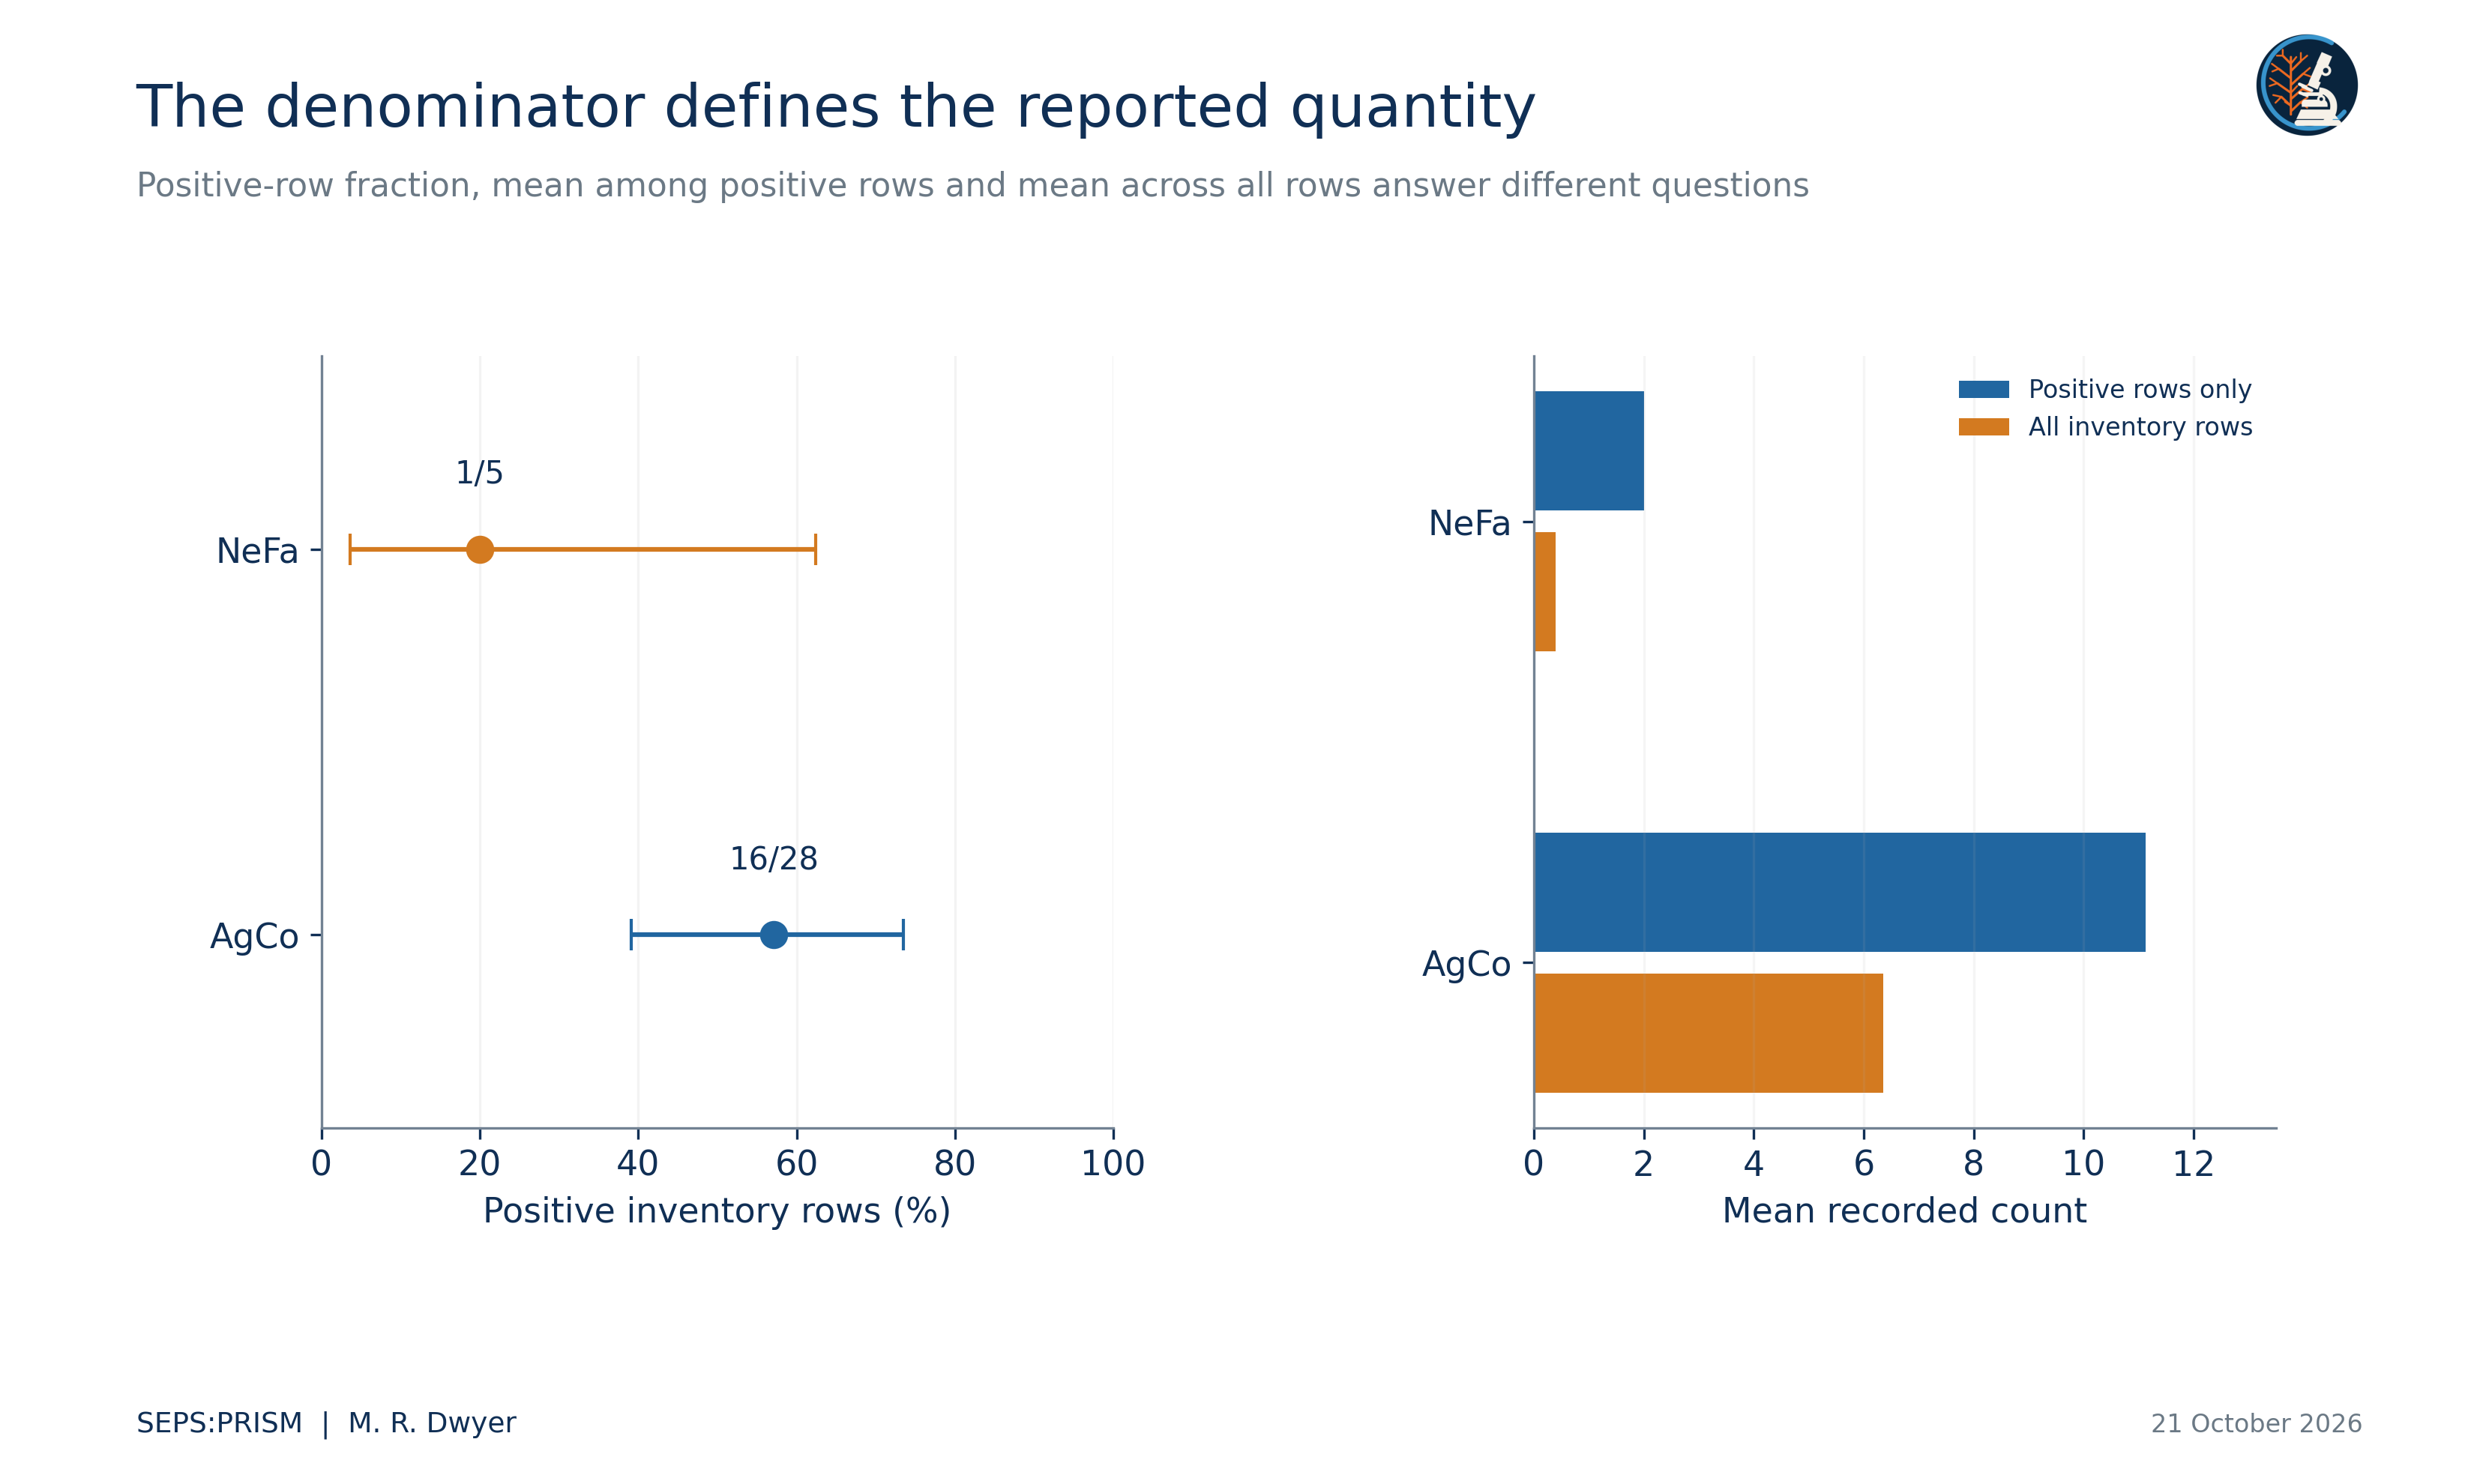
Holding the historical positive numerator fixed, 16/26 yields 61.5385% and 16/28 yields 57.1429%. The corresponding watersnake alternatives, 1/4 and 1/5, yield 25.0% and 20.0%. These scenarios quantify the consequence of the discrepancy without selecting an eligible examination set. A revised denominator may also require a revised numerator, so we do not treat this display as a sensitivity interval around a population estimate.
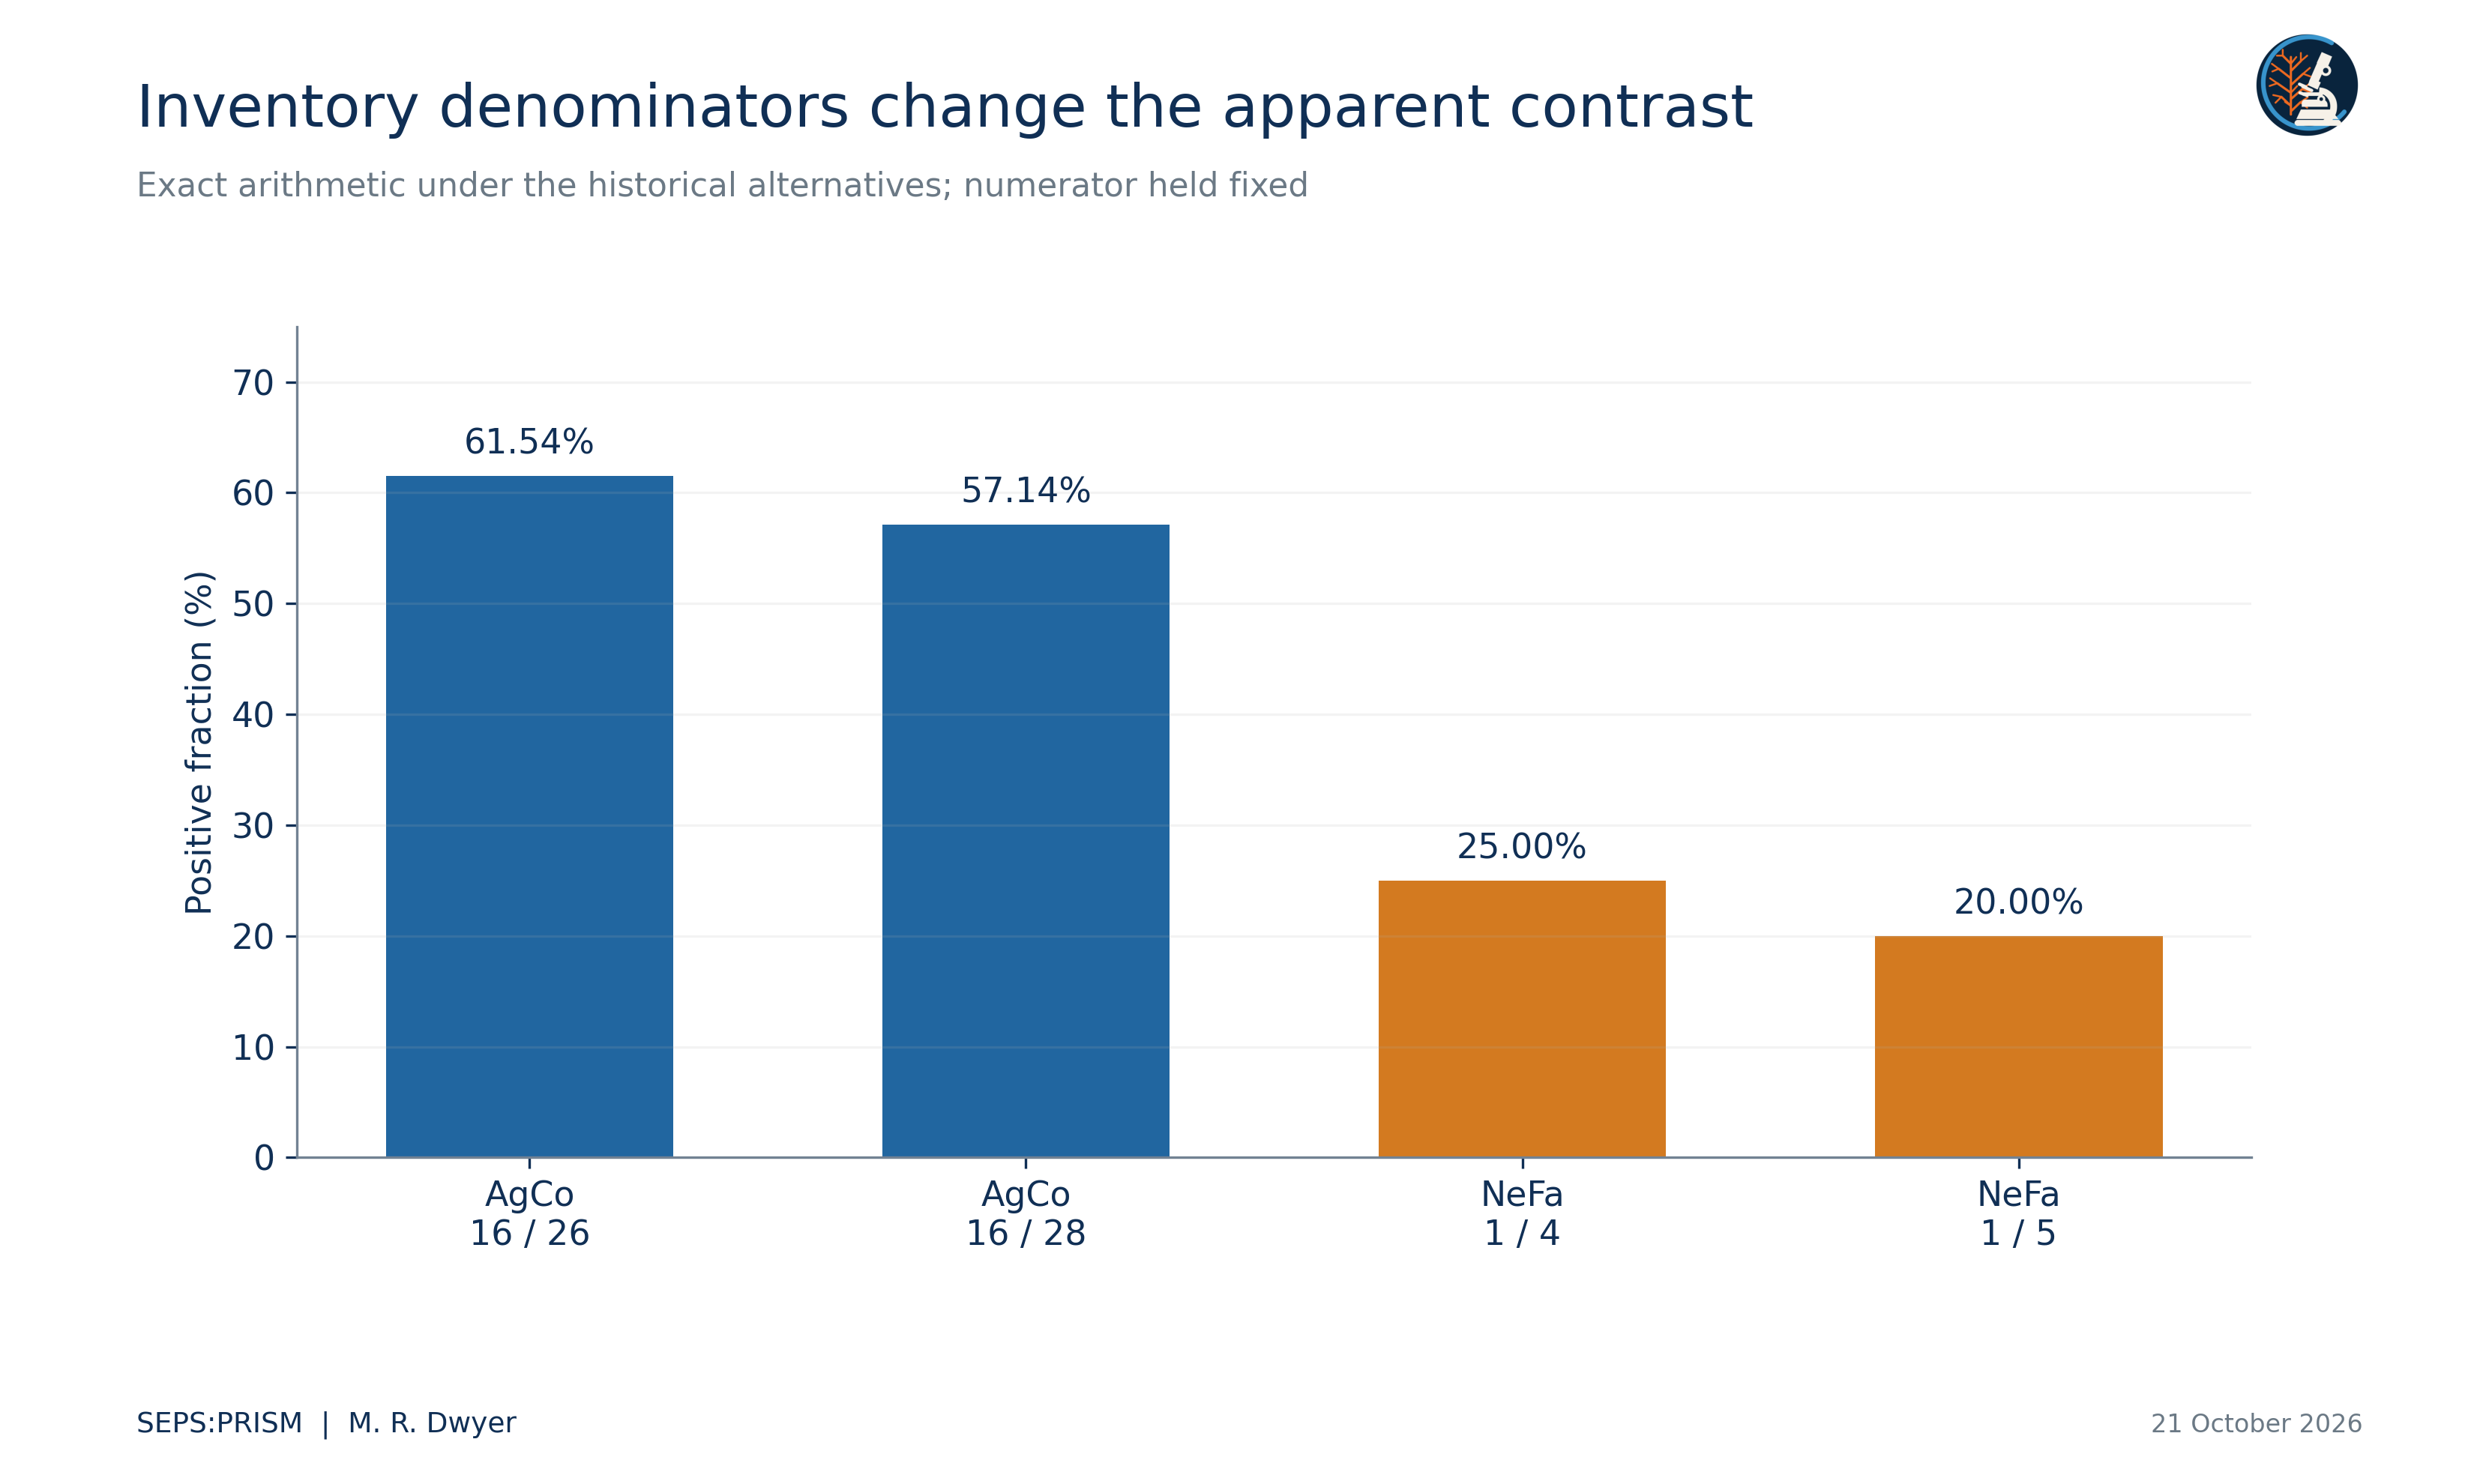
Table 2. Separate county summary
| County | Rows and positive rows | Recorded total |
|---|---|---|
| Broward | 4 and 2 | 26 |
| Collier | 2 and 2 | 72 |
| Miami-Dade | 19 and 11 | 73 |
| Monroe | 1 and 1 | 7 |
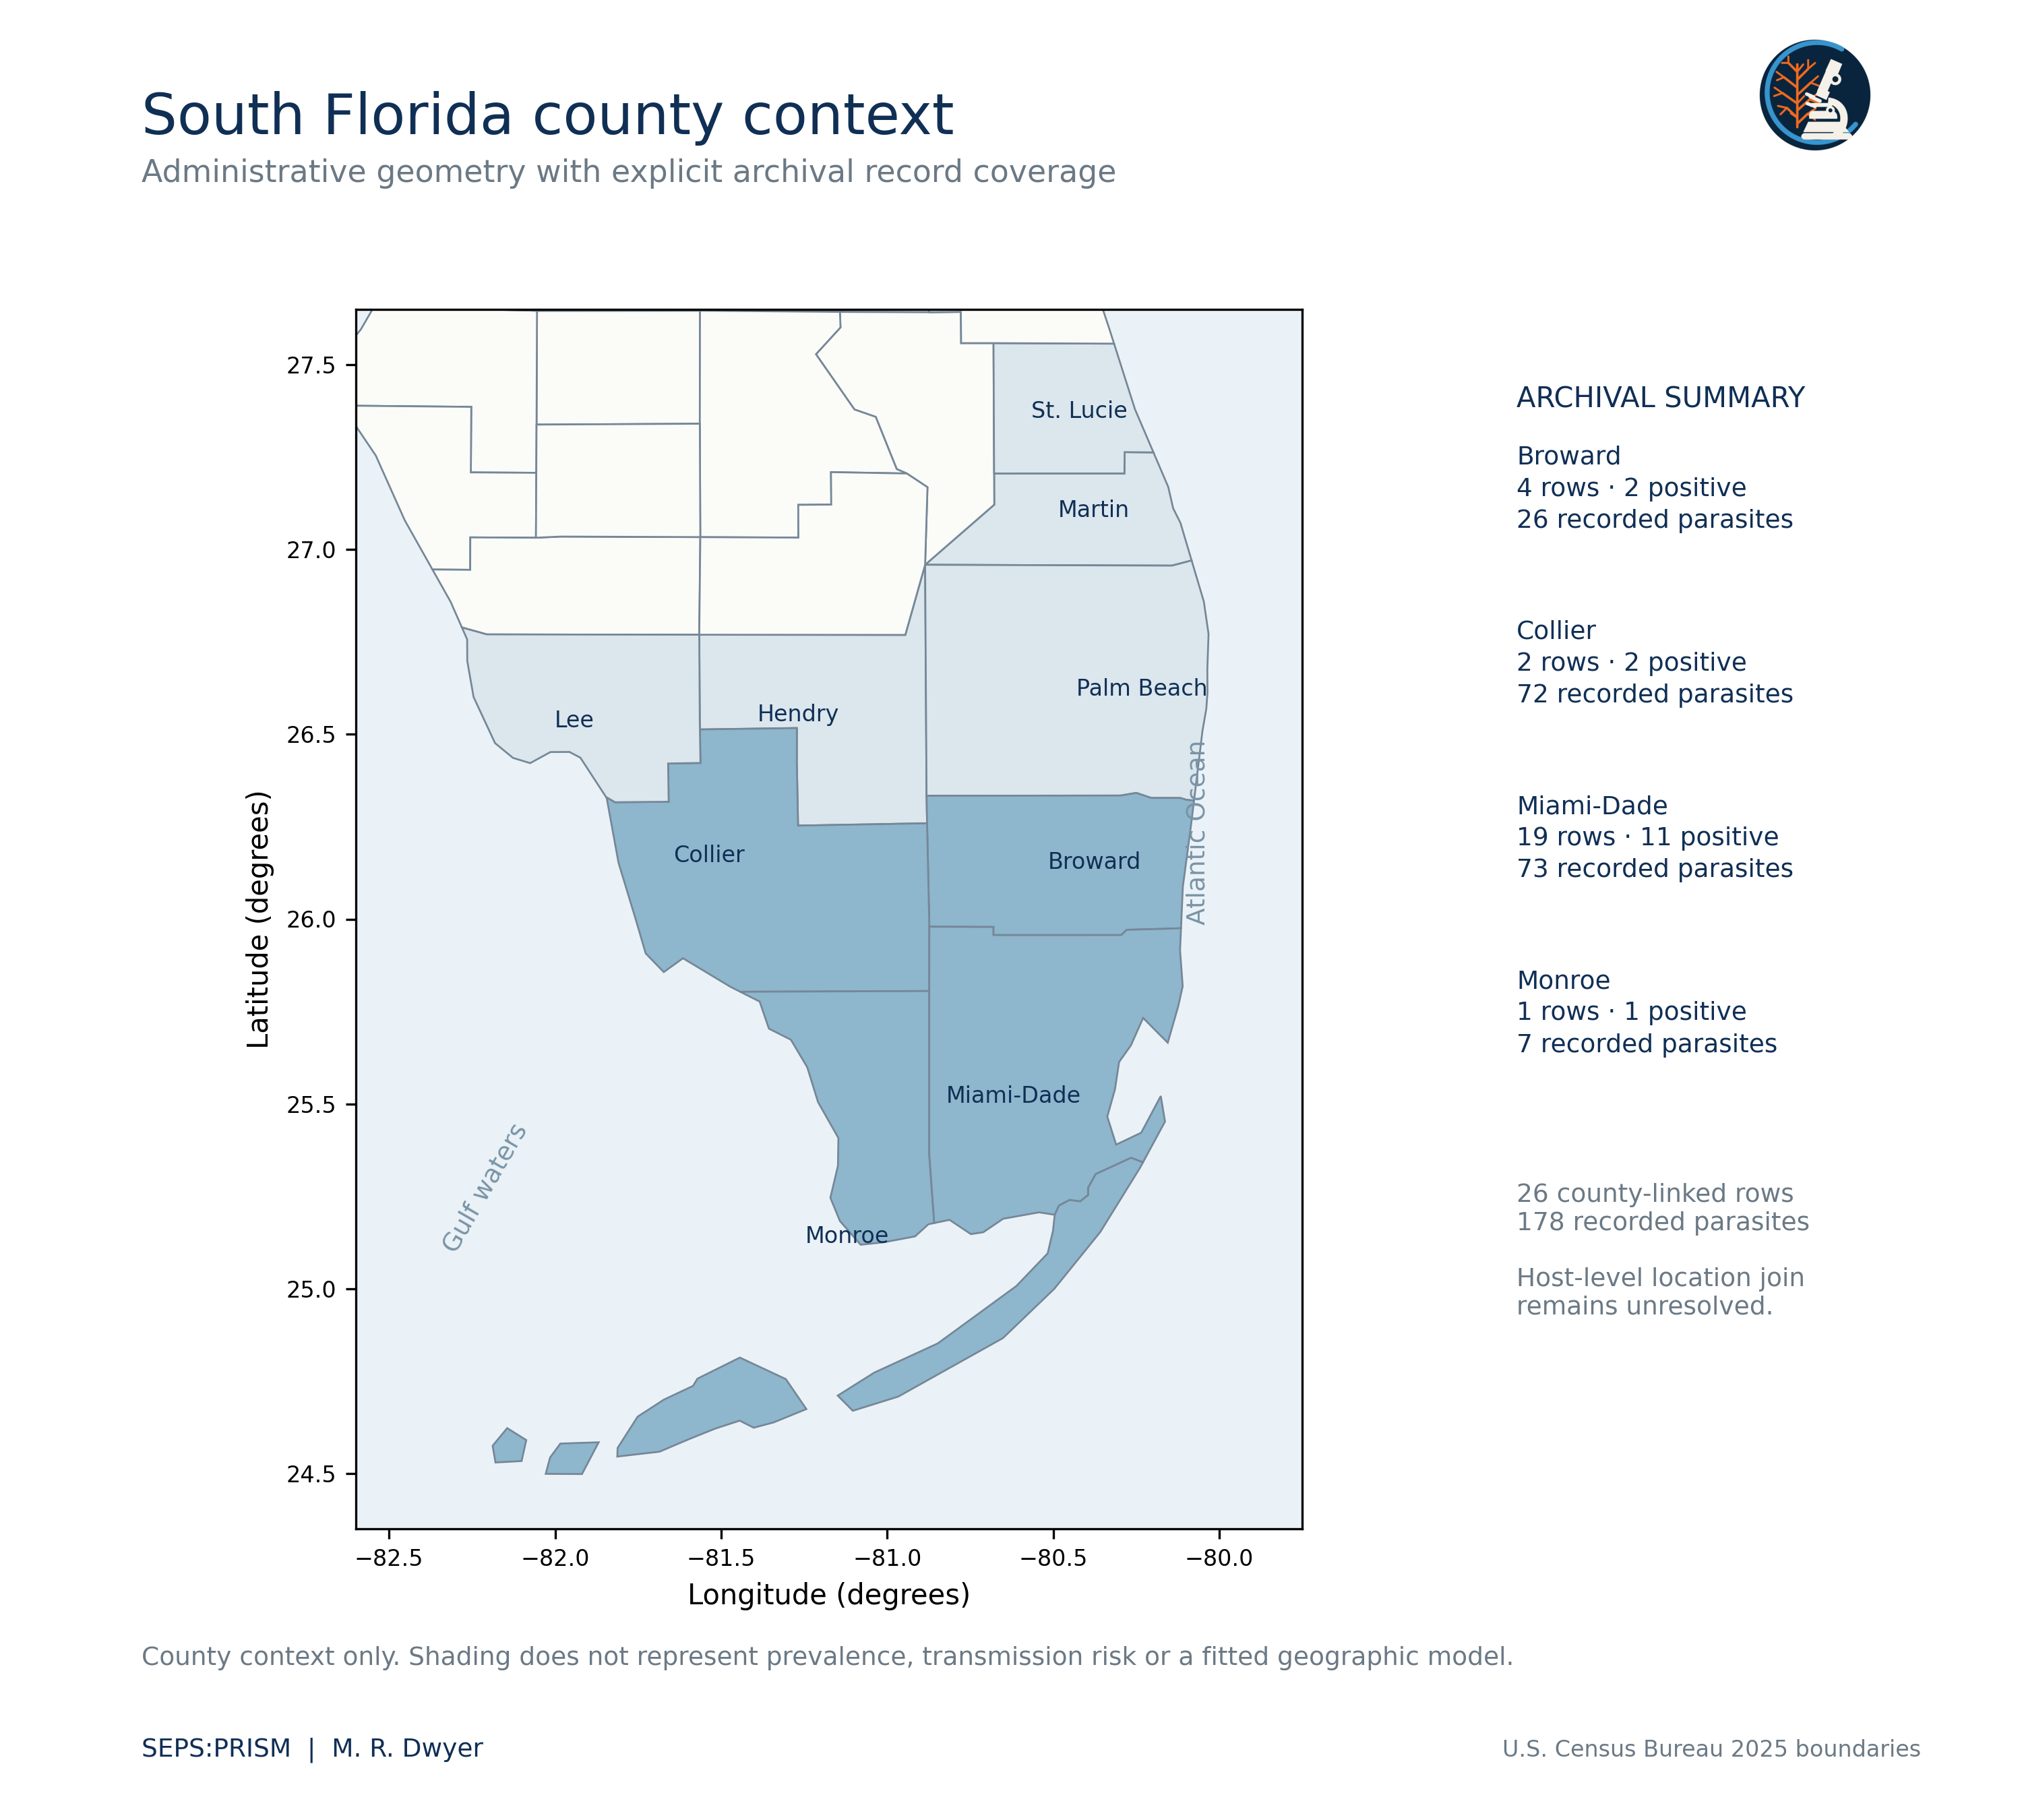
The county summary totals 26 rows and 178 counts. It does not identify the two-row difference from the 28-row inventory. We do not construct a host-location join from these margins.
We redraw county context from the U.S. Census Bureau (2025) cartographic boundary file. We retain county names and show the archival summary separately. The geometry does not locate individual hosts. We replace the legacy risk interpretation with explicit record coverage because an opportunistic total cannot estimate exposure risk without a defined sampling frame, effort and outcome. Generalized county boundaries also cannot support precise site placement or distance measurement.
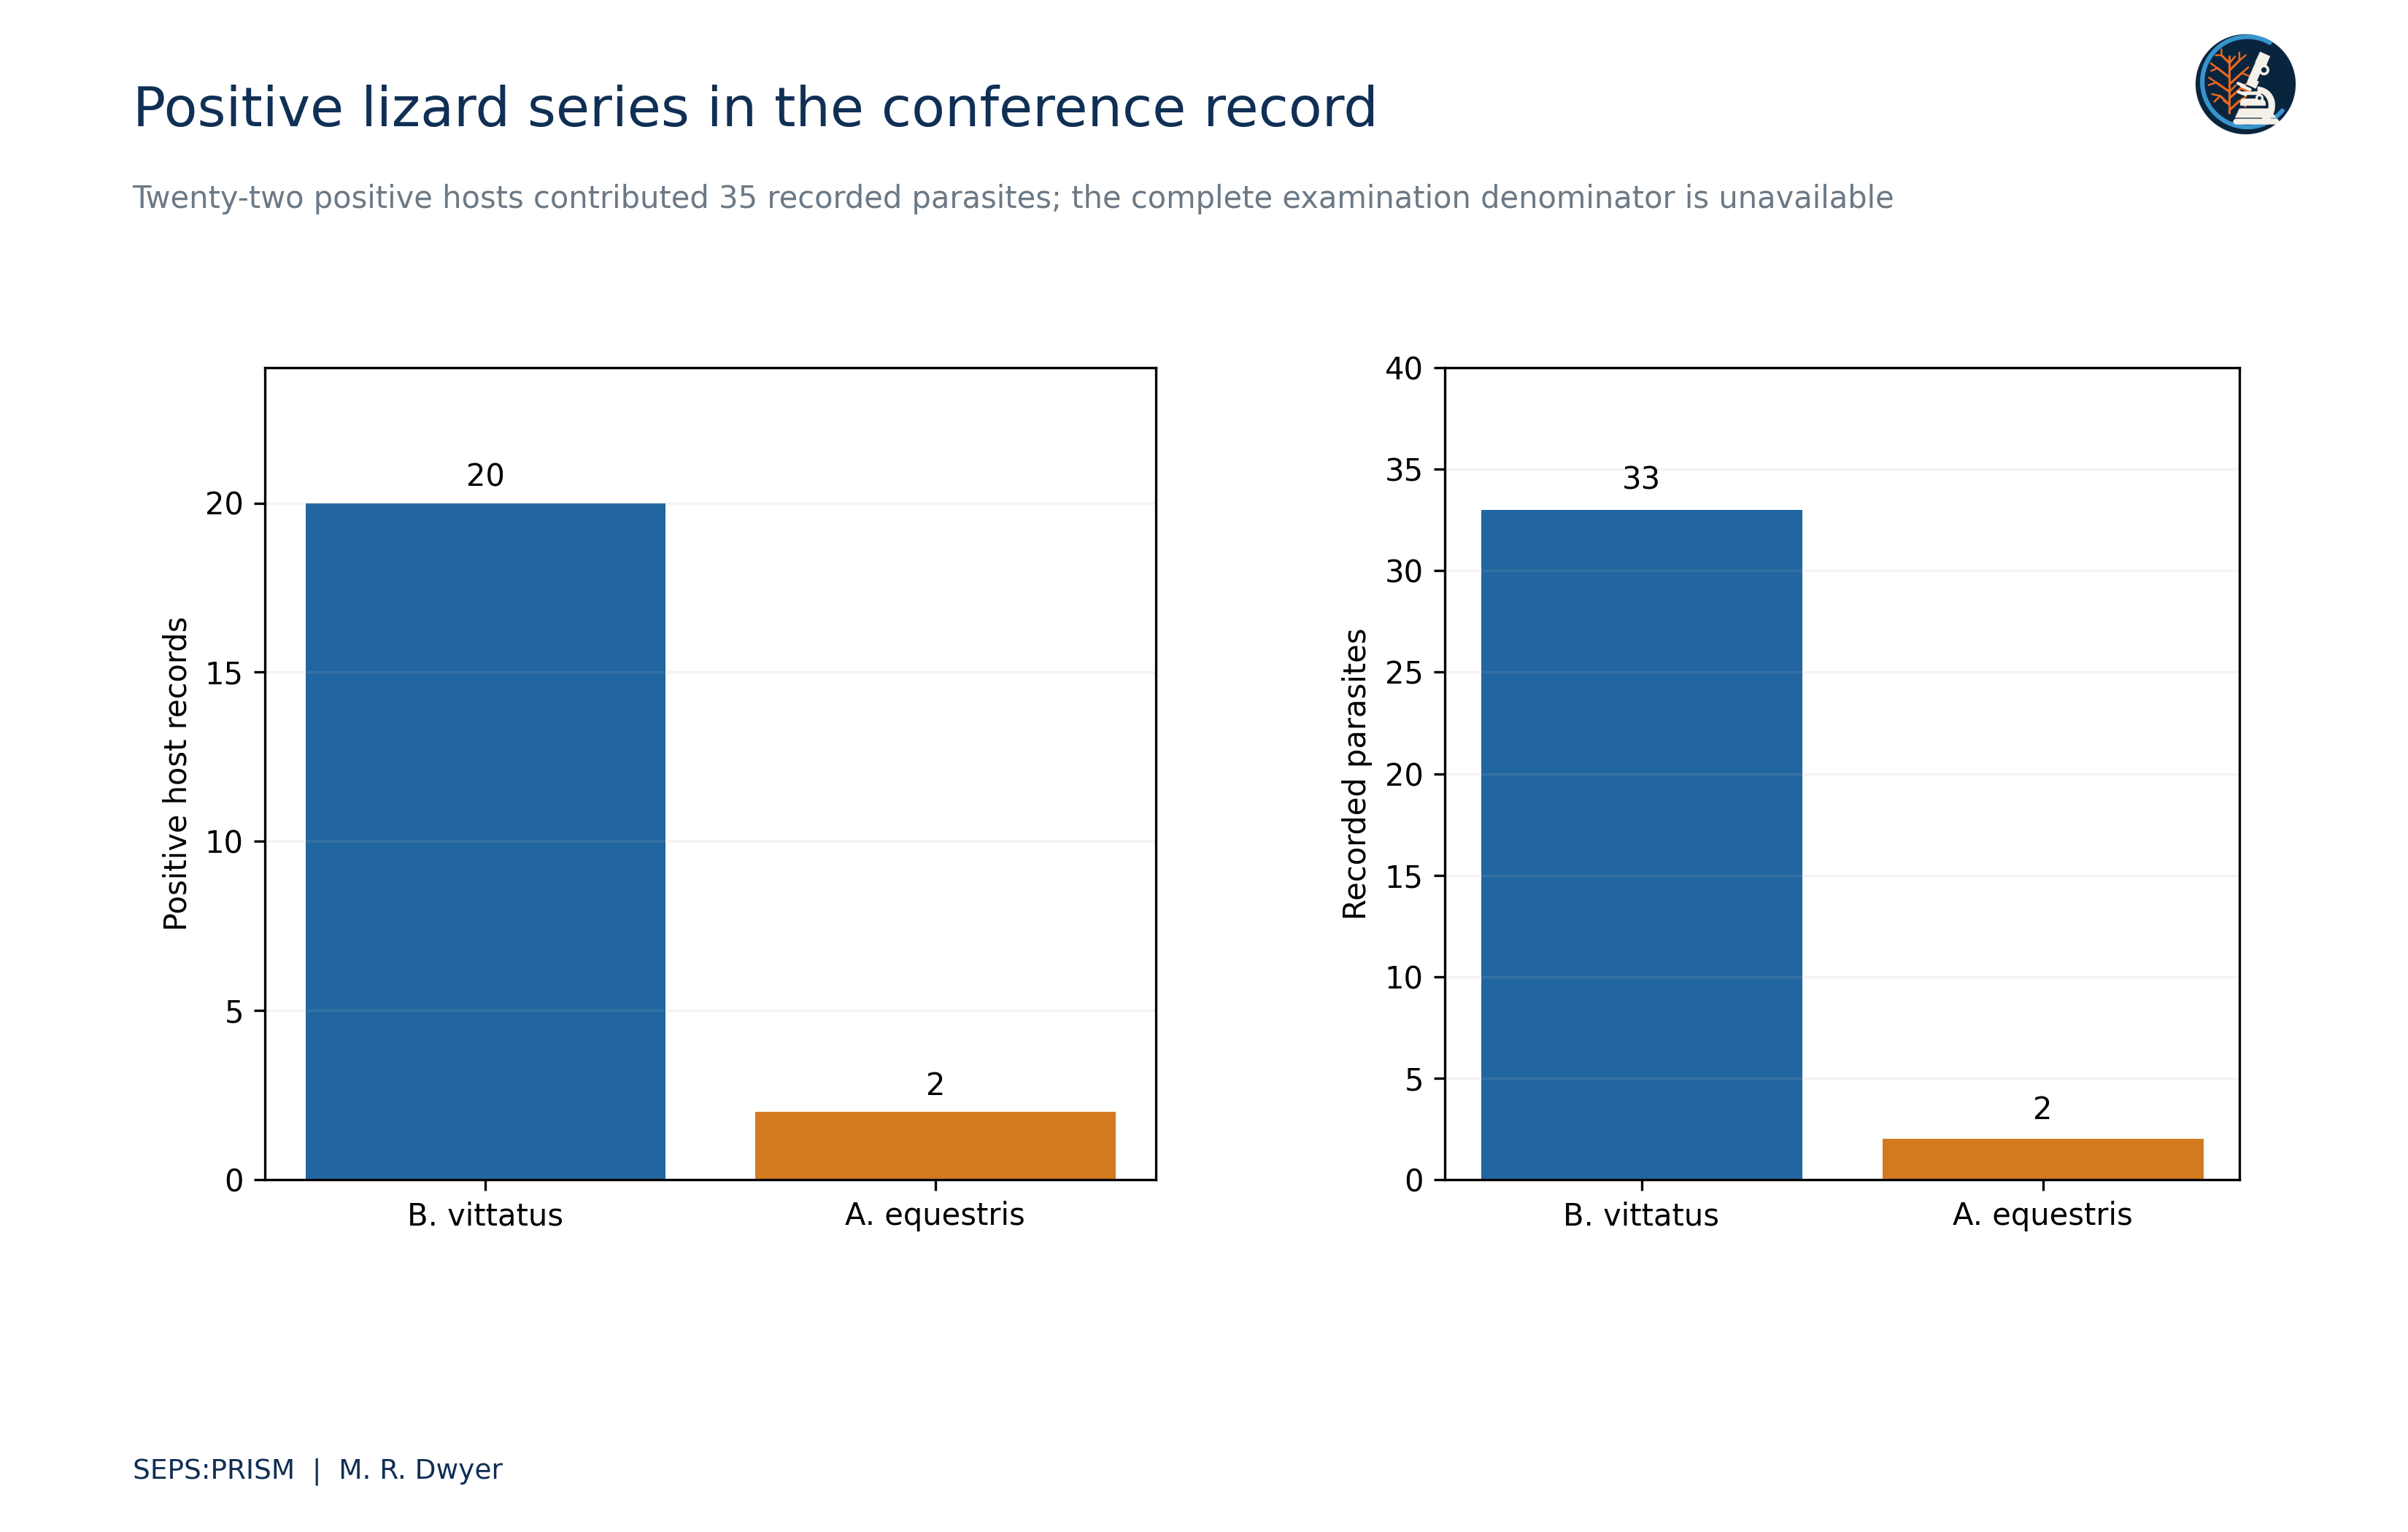
The supplied conference presentation summarizes 27 autopsy entries as 22 positive lizards, comprising 20 Basiliscus vittatus with 33 parasites and two Anolis equestris with two parasites (Dwyer, 2026c). It reports four adult, nine immature and 22 unspecified developmental labels. These aggregate values define a positive series, so 22/22 would describe its selection rule rather than prevalence. The original workbook is absent from this thread, and the plotted host measurements do not replace its row-level values. We retain the aggregate table while withholding a fitted host-size effect.
Table 3. Positive lizard series
| Host taxon | Positive host records | Reported parasites |
|---|---|---|
| Basiliscus vittatus | 20 | 33 |
| Anolis equestris | 2 | 2 |
| Total | 22 | 35 |
Source: Dwyer (2026c), slide 5. The series contains positive records only. We do not pool it with the 33 snake inventory rows or infer the number of negative lizards examined.
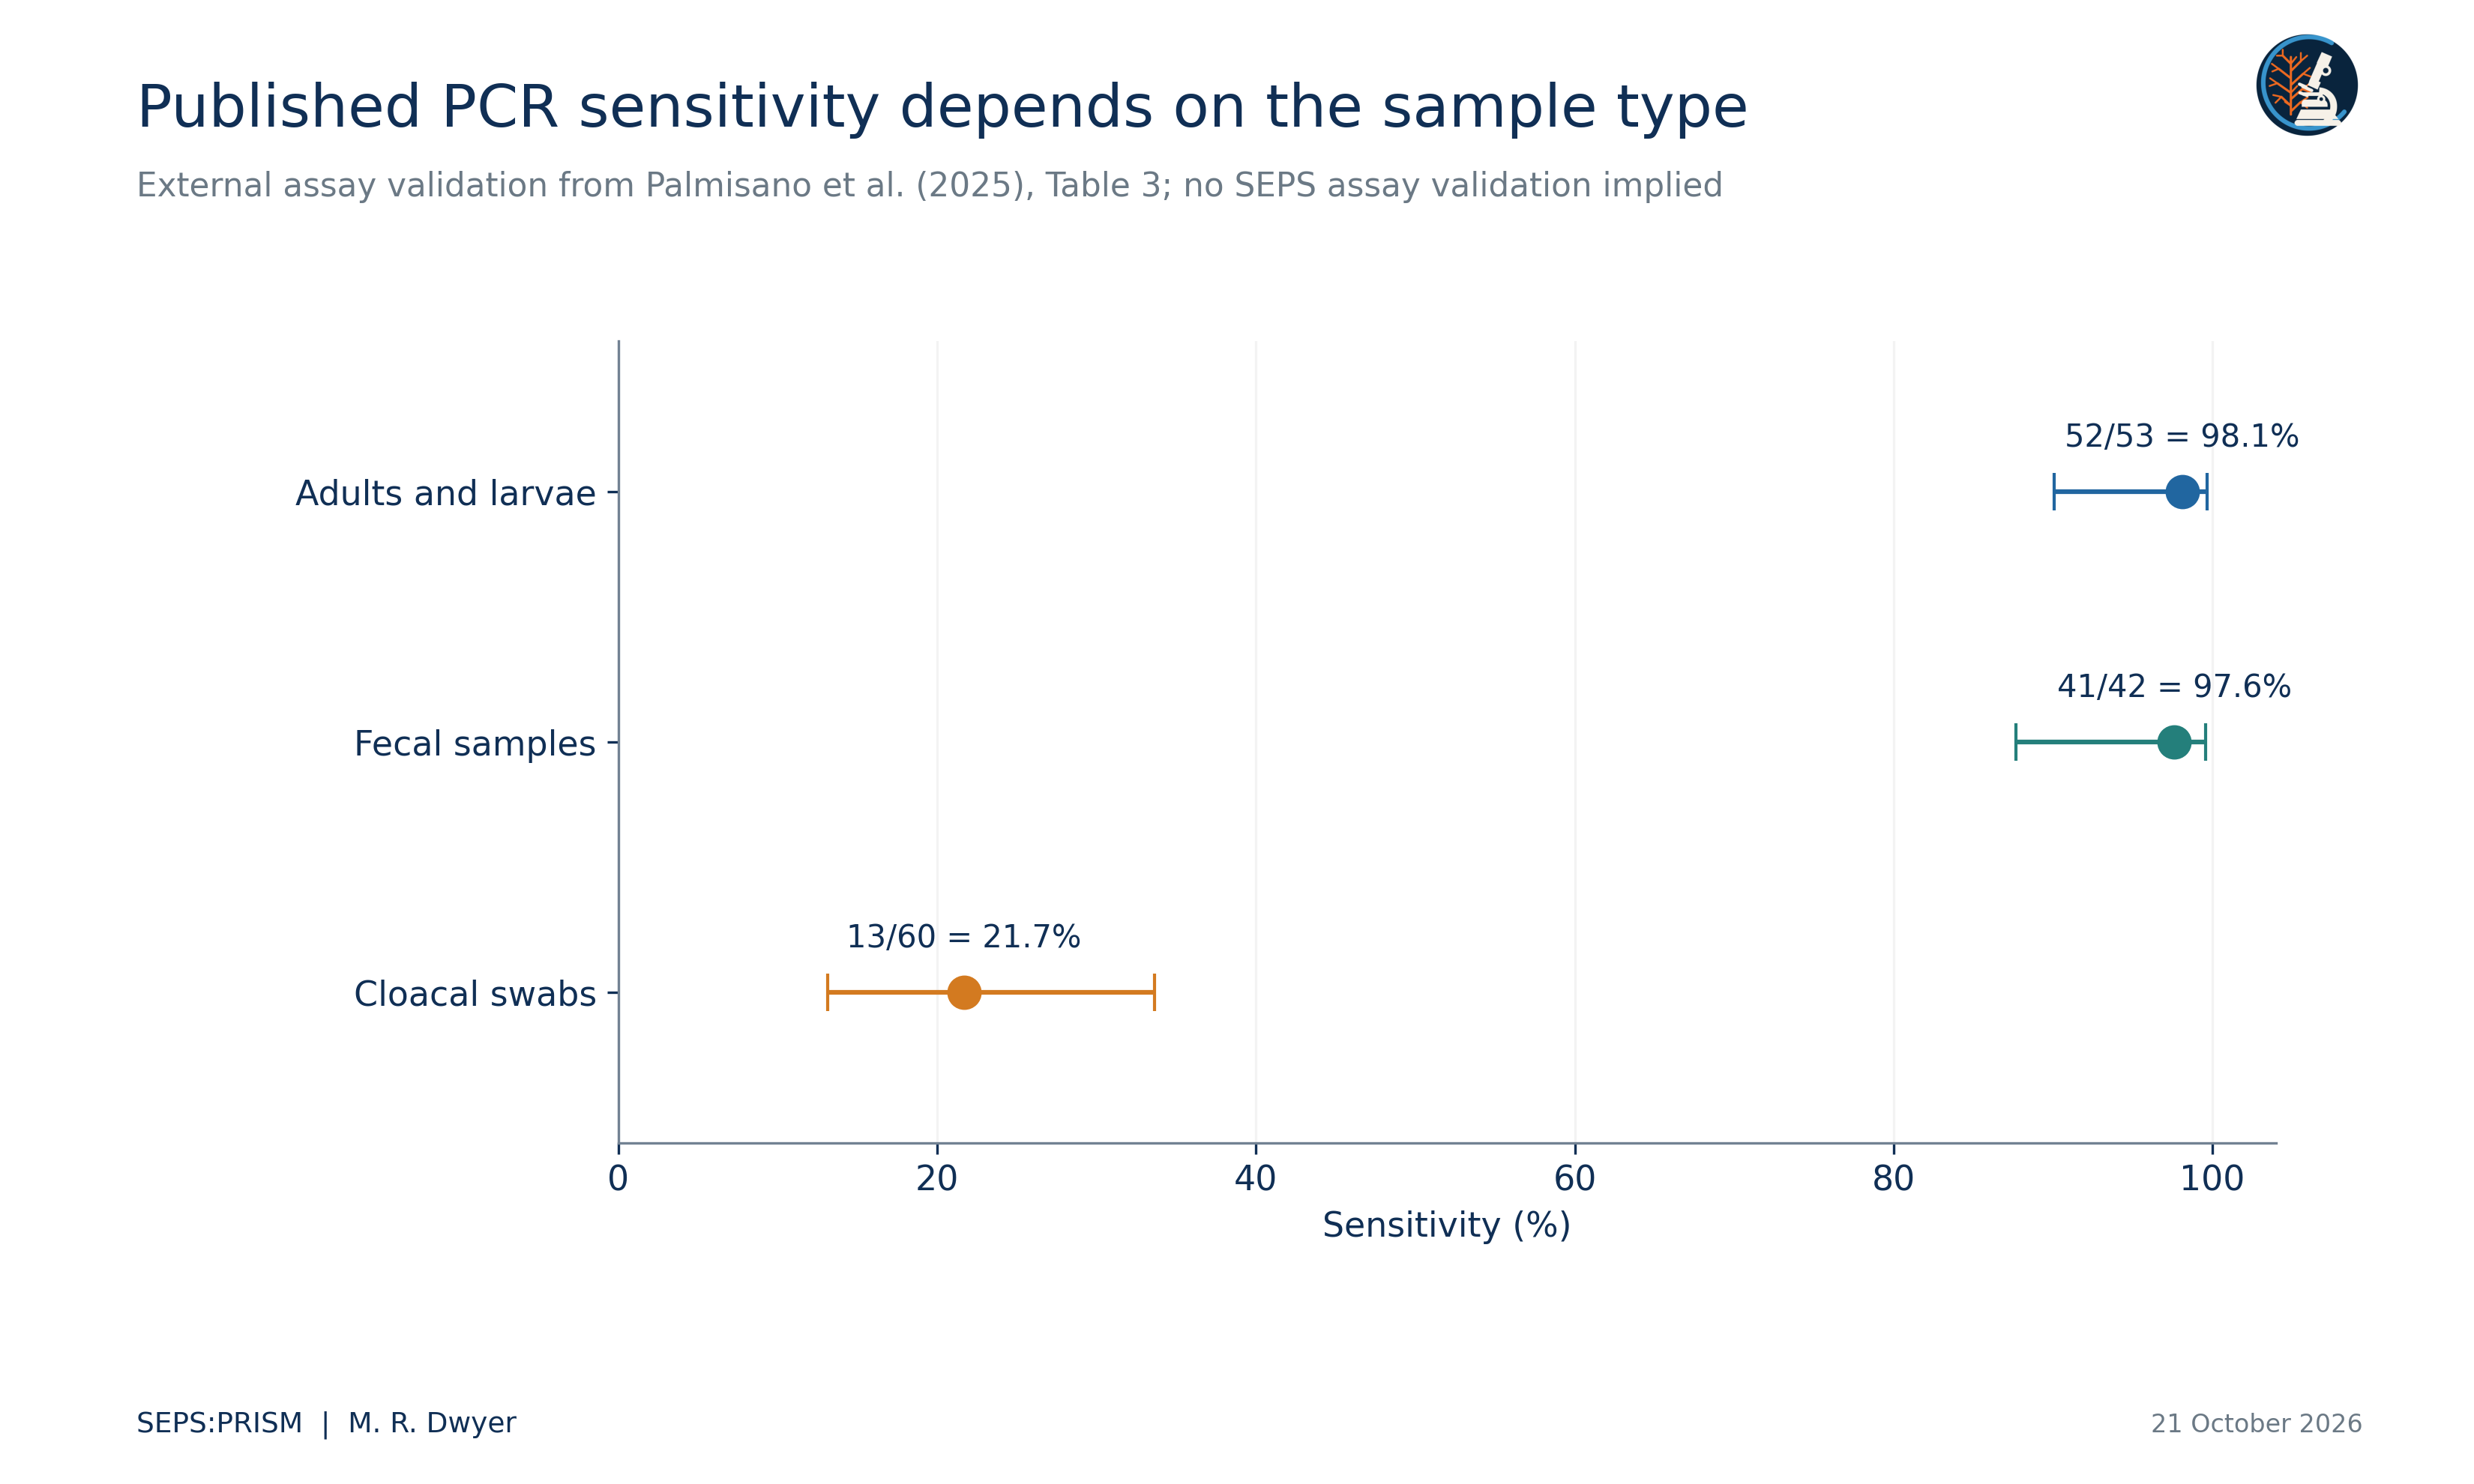
Palmisano et al. (2025) reported amplification in 52/53 known-positive adult or larval pentastome samples, 41/42 known-positive fecal samples and 13/60 known-positive cloacal swabs. We redraw those counts with newly calculated Wilson intervals rather than reuse the older two-bar graphic. The marked sample-type contrast shows why a field non-detection needs its method attached. These external assay results do not validate SEPS methods or supply a correction factor for this archive.
 (6)
For a prospective repeated-detection study, Z_i denotes an underlying infection state, ψ_i its probability and p_ij detection probability at visit j. This simplified formulation assumes no false positives and a stable state over the repeated visits. We would add a false-positive process or a dynamic state model when those assumptions fail. Without replication or external detection information, absence and non-detection generally remain confounded.
 (7)
 (8)
This prospective count model links mean burden μ_i to measured hydroperiod h_i, disturbance u_i and host length L_i, with site and period effects. We would choose covariates and sampling blocks before fitting. A count model must represent actual counting opportunity; we cannot repair a missing organ examination by inserting a zero. We do not fit this model to the present transcription because its required covariates and count eligibility remain unresolved.
 (9)
Both quantities require joint eligibility for targets A and B. A host unexamined for B contributes neither a joint negative nor a jointly evaluable denominator. A large odds ratio would indicate conditional association under the specified sampling design, not necessarily facilitation, shared transmission or a causal interaction. Zero cells require an explicitly chosen estimation method rather than silent continuity corrections.
We would model host traits, site, season and examination method before attributing residual co-occurrence to within-host interaction. Shared prey, host age and capture pathway can generate association even when parasites never affect each other. Longitudinal sampling, pathology and experimentally justified contrasts would address different causal questions. The earlier simulated host-by-taxon tables and hypothetical ordination statistics do not supply those observations and therefore do not appear in the empirical results.
FieldView and direct import preserve host, event and locality information. TEGUMENT links each crop to its original image. HookFuse records diagnostic characters and their uncertainty. FUZZARIA flags insufficient anatomy, unresolved taxonomy and contradictions between specimen and summary records. Expert review then determines which taxonomic level each observation supports (Dwyer, 2026a). The resulting dataset distinguishes exact count, minimum count, presence-only evidence and indeterminate count before any ecological model reads the records.
The next biological advance requires the host examination ledger, the original lizard workbook and specimen-level determinations. Those records would allow organ-specific denominators and a host-by-taxon matrix. Until then, the present calculations provide reproducible descriptive results and specific source-verification priorities. We can distribute the technical report and its data without presenting the archive as a completed prevalence survey or a fitted geographic risk model.
The recovered necropsy master workbook adds a distinct reptile series with 194 observation rows and 81 source-local host identifiers. It includes no cottonmouth host rows and therefore cannot resolve the cottonmouth inventory denominator by itself. The accompanying PARAPLEX report analyzes that workbook separately and retains its host and sample keys. Its pentastome rows sum to 33 for 20 Basiliscus vittatus hosts and two for two Anolis equestris hosts. These totals agree with the positive lizard series in the conference presentation, while a Thamnophis sauritus record contributes three additional pentastomes. Agreement at the aggregate level supports reconciliation of the 35-lizard-parasite subtotal, but it does not prove an individual specimen join or identify the parasites to species (Fall2019_Fall2023_NecropsyData_MASTER(1), n.d.; Dwyer, 2026c).
Independent arithmetic reproduced the archival host-count sums, positive-row fractions, conditional Wilson intervals, Gini coefficients and leave-one-record-out means. The source workbook improves ecological context without changing the 33 snake inventory values. We retain all examination and individual-linkage limits when interpreting those values.
Bush, A. O., Lafferty, K. D., Lotz, J. M., & Shostak, A. W. (1997). Parasitology meets ecology on its own terms: Margolis et al. revisited. Journal of Parasitology, 83(4), 575–583. https://doi.org/10.2307/3284227
Dwyer, M. R. (2026a). SEPS:PRISM methodology reference (Version 1.2, 18 October 2026) [Methodology specification]. Society for Evolutionary Parasite Systematics.
Dwyer, M. R. (2026b). SEPS Everglades parasite synthesis [Unpublished source manuscript and archival transcription]. Society for Evolutionary Parasite Systematics.
Dwyer, M. R. (2026c). Morphology and host associations of pentastomid parasites in introduced lizards of South Florida 2019 to 2023 [Conference presentation]. Society for Evolutionary Parasite Systematics.
Dwyer, M. R. (2026d). Putative mixed pentastomid helminth infection in a Florida cottonmouth from Everglades National Park [Unpublished case manuscript]. Society for Evolutionary Parasite Systematics.
Fall2019_Fall2023_NecropsyData_MASTER(1) [Unpublished necropsy workbook]. (n.d.). Supplied research archive. Sheet1, main reptile observations in rows 2–195; amphibian notes in rows 210–215; identification follow-ups in rows 220–231.
Miller, M. A., Kinsella, J. M., Snow, R. W., Falk, B. G., Reed, R. N., Goetz, S. M., Mazzotti, F. J., Guyer, C., & Romagosa, C. M. (2020). Highly competent native snake hosts extend the range of an introduced parasite beyond its invasive Burmese python host. Ecosphere, 11(6), e03153. https://doi.org/10.1002/ecs2.3153
Miller, M. A., Kinsella, J. M., Snow, R. W., Hayes, M. M., Falk, B. G., Reed, R. N., Mazzotti, F. J., Guyer, C., & Romagosa, C. M. (2018). Parasite spillover: Indirect effects of invasive Burmese pythons. Ecology and Evolution, 8(2), 830–840. https://doi.org/10.1002/ece3.3557
Palmisano, J. N., Hazelrig, C. M., Gazil, J. A., Hanco, J. K., Farrell, T. M., Bogan, J. E., Jr., Nemeth, N. M., & Savage, A. E. (2025). A novel PCR assay and sampling techniques for the detection of Raillietiella orientalis. Frontiers in Amphibian and Reptile Science, 3, 1531792. https://doi.org/10.3389/famrs.2025.1531792
U.S. Census Bureau. (2025). Cartographic boundary file for United States counties at 1 to 20 million scale [Geospatial dataset]. https://www2.census.gov/geo/tiger/GENZ2025/shp/cb_2025_us_county_20m.zip
Walden, H. D. S., Iredale, M. E., Childress, A., Wellehan, J. F. X., Jr., & Ossiboff, R. J. (2020). Case report: Invasive pentastomes, Raillietiella orientalis (Sambon, 1922), in a free-ranging banded water snake (Nerodia fasciata) in north central Florida, USA. Frontiers in Veterinary Science, 7, 467. https://doi.org/10.3389/fvets.2020.00467
Wilson, E. B. (1927). Probable inference, the law of succession, and statistical inference. Journal of the American Statistical Association, 22(158), 209–212. https://doi.org/10.1080/01621459.1927.10502953